Thursday, July 31, 2014

An introduction to systemd for CentOS 7

http://www.openlogic.com/wazi/bid/351296/an-introduction-to-systemd-for-centos-7

With Red Hat Enterprise Linux 7 released and CentOS version 7 newly unveiled, now is a good time to cover systemd, the replacement for legacy System V (SysV) startup scripts and runlevels. Red Hat-based distributions are migrating to systemd because it provides more efficient ways of managing services and quicker startup times. With systemd there are fewer files to edit, and all the services are compartmentalized and stand separate from each other. This means that should you screw up one config file, it won't automatically take out other services.
Systemd has been the default system and services manager in Red Hat Fedora since the release of Fedora 15, so it is extensively field-tested. It provides more consistency and troubleshooting ability than SysV – for instance, it will report if a service has failed, is suspended, or is in error. Perhaps the biggest reason for the move to systemd is that it allows multiple services to start up at the same time, in parallel, making machine boot times quicker than they would be with legacy runlevels.
Under systemd, services are now defined in what are termed unit files, which are text files that contain all the configuration information a service needs to start, including its dependencies. Service files are located in /usr/lib/systemd/system/. Many but not all files in that directory will end in .service; systemd also manages sockets and devices.
No longer do you directly modify scripts to configure runlevels. Within systemd, runlevels have been replaced by the concept of states. States can be described as "best efforts" to get a host into a desired configuration, whether it be single-user mode, networking non-graphical mode, or something else. Systemd has some predefined states created to coincide with legacy runlevels. They are essentially aliases, designed to mimic runlevels by using systemd.
States require additional components above and beyond services. Therefore, systemd uses unit files not only to configure services, but also mounts, sockets, and devices. These units' names end in .sockets, .devices, and so on.
Targets, meanwhile, are logical groups of units that provide a set of services. Think of a target as a wrapper in which you can place multiple units, making a tidy bundle to work with.
Unit files are built from several configurable sections, including unit descriptions and dependencies. Systemd also allows administrators to explicitly define a service's dependencies and load them before the given service starts by editing the unit files. Each unit file has a line that starts After= that can be used to define what service is required before the current service can start. WantedBy=lines specify that a target requires a given unit.
Targets have more meaningful names than those used in SysV-based systems. A name like graphical.target gives admins an idea of what a file will provide! To see the current target at which the system is residing, use the command systemctl get-default. To set the default target, use the command systemctl set-default targetname.target. targetname can be, among others:
  • rescue.target
  • multi-user.target
  • graphical.target
  • reboot.target
Looking at the above it becomes obvious that although there is no direct mapping between runlevels and targets, systemd provides what could loosely be termed equivalent levels.
Another important feature systemd implements is cgroups, short for control groups, which provide security and manageability for the resources a system can use and control. With cgroups, services that use the same range of underlying operating system calls are grouped together. These control groups then manage the resources they control. This grouping performs two functions: it allows administrators to manage the amount of resources a group of services gets, and it provides additional security in that a service in a certain cgroup can't jump outside of cgroups control, preventing it for example from getting access to other resources controlled by other cgroups.
Cgroups existed in the old SysV model, but were not really implemented well. systemd attempts to fix this issue.

First steps in systemd

Under systemd you can still use the service and chkconfig commands to manage those additional legacy services, such as Apache, that have not yet been moved over to systemd management. You can also use service command to manage systemd-enabled services. However, several monitoring and logging services, including cron and syslog, have been rewritten to use the functionality that is available in systemd, in part because scheduling and some of the cron functionality is now provided by systemd.
You can also manage systemd with a GUI management tool called systemd System Manger, though it is not usually installed by default. To install it, as root, run yum -y install systemd-ui.
How can you start managing systemd services? Now that Centos 7 is out of the starting gate we can start to experiment with systemd and understand its operation. To begin, as the root user in a terminal, type chkconfig. The output shows all the legacy services running. As you can see by the big disclaimer, most of the other services that one would expect to be present are absent, because they have been migrated to systemd management.
Red Hat-based OSes no longer use the old /etc/initab file, but instead use a system.default configuration file. You can symlink a desired target to the system.default in order to have that target start up when the system boots. To configure the target to start a typical multi-user system, for example, run the command below:
ln -sf /lib/systemd/system/multi-user.target /etc/systemd/system/default.target
After you make the symlink, run systemctl, the replacement for chkconfig. Several pages of output display, listing all the services available:
systemctl
  • Unit – the service name
  • Load – gives status of the service (such as Loaded, Failed, etc.)
  • Active – indicates whether the status of the service is Active
  • Description – textual description of the unit
The key commands and arguments in systemctl are similar to the legacy ones found in chkconfig – for example, systemctl start postfix.service.
In the same vein, use systemctl stop and systemctl status to stop services or view information. This syntax similarity to chkconfig arguments is by design, to make the transition to systemd as smooth as possible.
To see all the services you can start using systemctl and their statuses, use the command
systemctl list-unit-files --type=service
services
While you can no longer enable a runlevel for a service using chkconfig --level, under systemd you can enable or disable a service when it boots. Use systemctl enable service to enable a service, and systemctl disable service to keep it from starting at boot. Get a service's current status (enabled or disabled) with the command systemctl is-enabled service.
Final thoughts on systemd

It may take you some time to get used to systemd, but you should plan to use it now before it becomes a requirement and management through legacy tools is no longer available. You should find that systemd makes managing services easier than it used to be with SysV.

Monday, July 28, 2014

Building a better Internet, one Tor relay at a time

http://parabing.com/2014/07/your-own-tor-relay

Everybody’s talking about privacy and anonymity on the Internet these days, and many people are concerned with their apparent demise. Understandably so, considering the torrent of revelations we’ve been getting for over a year now, all about the beliefs and practices of (in)famous three-letter agencies.
We’re not about to reiterate the valid concerns of privacy and/or anonymity minded people. Instead, we are going to demonstrate how one can make a small but extremely significant contribution towards an Internet where anonymity is an everyday practical option and not an elusive goal. (If you’re also interested in privacy, then maybe it’s time to setup your very own OpenVPN server.)
You’ve probably heard about Tor. Technically speaking, it is a global mesh of nodes, also known as relays, which encrypt and bounce traffic between client computers and servers on the Internet. That encryption and bouncing of traffic is done in such a way, that it is practically impossible to know who visited a web site or used a network service in general. To put it simply, anytime I choose to surf the web using Tor it’s impossible for the administrators of the sites I visit to know my real IP address. Even if they get subpoenaed, they are just unable to provide the real addresses of the clients who reached them through Tor.
If you care about your anonymity or you’re just curious about Tor, then you may easily experience it by downloading the official, freely available Tor Browser Bundle. The effectiveness of Tor relies in the network of those aforementioned relays: The more active relays participate in the Tor network, the stronger the anonymity Tor clients enjoy is.
advertisment
It is relatively easy to contribute to the strengthening of the Tor network. All you really need is an active Internet connection and a box/VM/VPS — or even a cheap computer like the Raspberry Pi. In the remainder of this post we demonstrate how one can setup a Tor relay on a VPS running Ubuntu Server 14.04 LTS (Trusty Tahr). You may follow our example to the letter or install Tor on some different kind of host, possibly running some other Linux distribution, flavor of BSD, OS X or even Windows.

Installation

We SSH into our Ubuntu VPS, gain access to the root account and add to the system a new, always up-to-date Tor repository:
$ sudo su
# echo "deb http://deb.torproject.org/torproject.org trusty main" >> /etc/apt/sources.list
If you’re not running the latest version of Ubuntu Server (14.04 LTS, at the time of this writing), then you should replace “trusty” with the corresponding codename. One way to find out the codename of your particular Ubuntu version is with the help of lsb_release utility:
# lsb_release -a
No LSB modules are available.
Distributor ID: Ubuntu
Description:    Ubuntu 14.04 LTS
Release:        14.04
Codename:       trusty
Now, let’s refresh all the local repositories:
# apt-get update
...
W: GPG error: http://deb.torproject.org trusty InRelease:
The following signatures couldn't be verified because the
public key is not available: NO_PUBKEY
The Tor repository signature cannot be verified, so naturally we get an error. The verification fails because the public key is missing. We may manually download that key and let APT know about it, but it’s better to install the deb.torproject.org-keyring package instead. That way, whenever the signing key changes, we won’t have to re-download the corresponding public key.
# apt-get install deb.torproject.org-keyring
Reading package lists... Done
Building dependency tree      
Reading state information... Done
The following NEW packages will be installed:
  deb.torproject.org-keyring
0 upgraded, 1 newly installed, 0 to remove and 0 not upgraded.
Need to get 4138 B of archives.
After this operation, 20.5 kB of additional disk space will be used.
WARNING: The following packages cannot be authenticated!
  deb.torproject.org-keyring
Install these packages without verification? [y/N] y
We confirm the installation of deb.torproject.org-keyring and then refresh the local repositories:
# apt-get update
This time around there should be no errors. To install Tor itself, we just have to type…
# apt-get install tor
Reading package lists... Done
Building dependency tree      
Reading state information... Done
The following extra packages will be installed:
  tor-geoipdb torsocks
Suggested packages:
  mixmaster xul-ext-torbutton socat tor-arm polipo privoxy apparmor-utils
The following NEW packages will be installed:
  tor tor-geoipdb torsocks
0 upgraded, 3 newly installed, 0 to remove and 0 not upgraded.
Need to get 1317 kB of archives.
After this operation, 5868 kB of additional disk space will be used.
Do you want to continue? [Y/n]y
That’s all great! By now, Tor should be up and running:
# netstat -antp
Active Internet connections (servers and established)
Proto Recv-Q Send-Q Local Address           Foreign Address         State       PID/Program name
tcp        0      0 0.0.0.0:22              0.0.0.0:*               LISTEN      808/sshd       
tcp        0      0 127.0.0.1:9050          0.0.0.0:*               LISTEN      973/tor        
tcp        0      0 10.10.10.235:22         10.10.10.250:49525      ESTABLISHED 2095/sshd: sub0
tcp6       0      0 :::22                   :::*                    LISTEN      808/sshd
But before we add a new relay to the Tor network, we should properly configure it first.

Configuration

The Tor configuration file is named torrc and it resides within the /etc/tor directory. Before we make any changes to it, it’s a good idea to keep a backup. Then we open up torrc with a text editor, e.g., nano:
# cp /etc/tor/torrc /etc/tor/torrc.original
# nano /etc/tor/torrc
We locate the following lines and modify them to fit our setup. Please take a closer look at our modifications:
SocksPort 0
Log notice file /var/log/tor/notices.log
Nickname parabing
ORPort 9001
DirPort 9030
Address noname.example.com # this is optional
ContactInfo cvarelas AT gmail DOT com
RelayBandwidthRate 128 KB
RelayBandwidthBurst 192 KB
ExitPolicy reject *:*
Some explaining is in order.
  • SocksPort 0
    We want Tor to act as a relay only and ignore connections from local applications.
  • Log notice file /var/log/tor/notices.log
    All messages of level “notice” and above should go to /var/log/tor/notices.log. Check the five available message levels here.
  • Nickname parabing
    A name for our Tor relay. Feel free to name yours anyway you like. The relay will be searchable in the various public relay databases by that name.
  • ORPort 9001
    This is the standard Tor port for incoming network connections.
  • DirPort 9030
    This is the standard port for distributing information about the public Tor directory.
  • Address noname.example.com
    This is optional but in some cases useful. If your relay has trouble participating in the Tor network during startup, then try providing here the fully qualified domain name or the public IP address of the host computer/VM/VPS.
  • ContactInfo cvarelas AT gmail DOT com
    You may type a real email address here — and you don’t have to care for syntax correctness: The address may be just intelligible, so if anyone wishes to contact you for any reason then he or she will have a chance to know an email of yours by looking up your relay in a public directory.
  • RelayBandwidthRate 128 KB
    The allowed bandwidth for incoming traffic. In this example it’s 128 kilobytes per second, that is 8 x 128 = 1024Kbps or 1Mbps. Please note that RelayBandwidthRate must be at least 20 kilobytes per second.
  • RelayBandwidthBurst 192 KB
    This is the allowed bandwidth burst for incoming traffic. In our example it’s 50% more than the allowed RelayBandwidthRate.
  • ExitPolicy reject *:*
    This relay does not allow exits to the “normal” Internet — it’s just a member of the Tor network. If you’re hosting the relay yourself at home, then it’s highly recommended to disallow exits. This is true even if you’re running Tor on a VPS. See the Closing comments section for more on when it is indeed safe to allow exits to the Internet.
advertisment
After all those modifications in /etc/tor/torrc we’re ready to restart Tor (it was automatically activated immediately after the installation). But before we do that, there might be a couple of things we should take care of.

Port forwarding and firewalls

It’s likely that the box/VM/VPS our Tor relay is hosted is protected by some sort of firewall. If this is indeed the case, then we should make sure that the TCP ports for ORPort and DirPort are open. For example, one of our Tor relays lives on a GreenQloud instance and that particular IaaS provider places a firewall in front of any VPS (instance). That’s why we had to manually open ports 9001/TCP and 9030/TCP on the firewall of that instance. There’s also the case of the ubiquitous residential NAT router. In this extremely common scenario we have to add two port forwarding rules to the ruleset of the router, like the following:
  • redirect all incoming TCP packets for port 9001 to port 9001 on the host with IP a.b.c.d
  • redirect all incoming TCP packets for port 9030 to port 9030 on the host with IP a.b.c.d
where a.b.c.d is the IP address of the relay host’s Internet-facing network adapter.

First-time startup and checks

To let Tor know about the fresh modifications in /etc/tor/torrc, we simply restart it:
# service tor restart
* Stopping tor daemon...
* ...
* Starting tor daemon...        [ OK ]
#
To see what’s going on during Tor startup, we take a look at the log file:
# tail -f /var/log/tor/notices.log
Jul 18 09:30:07.000 [notice] Bootstrapped 80%: Connecting to the Tor network.
Jul 18 09:30:07.000 [notice] Guessed our IP address as 37.b.c.d (source: 193.23.244.244).
Jul 18 09:30:08.000 [notice] Bootstrapped 85%: Finishing handshake with first hop.
Jul 18 09:30:09.000 [notice] Bootstrapped 90%: Establishing a Tor circuit.
Jul 18 09:30:09.000 [notice] Tor has successfully opened a circuit. Looks like client functionality is working.
Jul 18 09:30:09.000 [notice] Bootstrapped 100%: Done.
Jul 18 09:30:09.000 [notice] Now checking whether ORPort 37.b.c.d:9001 and DirPort 37.b.c.d:9030 are reachable... (this may take up to 20 minutes -- look for log messages indicating success)
Jul 18 09:30:10.000 [notice] Self-testing indicates your DirPort is reachable from the outside. Excellent.
Jul 18 09:30:11.000 [notice] Self-testing indicates your ORPort is reachable from the outside. Excellent. Publishing server descriptor.
Jul 18 09:31:43.000 [notice] Performing bandwidth self-test...done.
(Press [CTR+C] to stop viewing the log file.) Notice that DirPort and ORPort are reachable — and that’s good. If any of those ports is not reachable, then check the firewall/port forwarding rules. You may also have to activate the Address directive in /etc/tor/torrc and restart the tor service.
You can look up any Tor relay in the Atlas directory. The relay shown on the screenshot is one of our own and it lives in a datacenter in Iceland, a country with strong pro-privacy laws.

Relay monitoring

One way to find out if your new, shiny Tor relay is actually active, is to look it up on Atlas. You may also monitor its operation in real-time with arm (anonymizing relay monitor). Before we install arm, let’s make a couple of modifications to /etc/tor/torrc. At first we locate the following two lines and uncomment them (i.e., delete the # character on the left):
ControlPort 9051
HashedControlPassword ...
We then move at the end of torrc and add this line:
DisableDebuggerAttachment 0
We make sure the modifications to torrc are saved and then restart tor:
# service tor restart
To install arm we type:
# apt-get install tor-arm
Reading package lists... Done
Building dependency tree      
Reading state information... Done
The following extra packages will be installed:
  python-geoip python-socksipy python-support python-torctl
The following NEW packages will be installed:
  python-geoip python-socksipy python-support python-torctl tor-arm
0 upgraded, 5 newly installed, 0 to remove and 0 not upgraded.
Need to get 406 kB of archives.
After this operation, 1,735 kB of additional disk space will be used.
Do you want to continue? [Y/n] y
There’s no need to work from the root account anymore, so let’s exit to our non-privileged user account:
# exit
exit
$
Right after the installation of the tor-arm package, a new account is created. The username of that account is debian-tor and for security reasons we run arm from the confines of said account:
$ sudo -u debian-tor arm

Closing comments

If you have more than one relays running, then no matter if they reside in the same local network or not you may want to put them in the same family, so clients will be able to avoid using more than one of your relays in a single circuit. To do that, on each node open up /etc/tor/torrc for editing, locate and uncomment the MyFamily directive and list the fingerprints of all your relays. One way to find the fingerprint of a relay is to look it up in Atlas; just search for the relay by name, click on the name and take a look at the Properties column. Another way is to simply run arm and check the information at the fourth line from the top of the terminal.
Thanks to arm (anonymizing relay monitor) we can monitor our Tor relay operation from our beloved terminal. The relay shown is hosted on Raspberry Pi with Raspbian.Tor relays can be configured to allow a predefined amount of traffic per time period and then hibernate until the next time period comes. Bandwidth isn’t always free in all VPS providers and/or ISPs, so you may want to define the AccountingMax and AccountingStart directives in your relay’s torrc file.
Now, in this post we setup a relay which is indeed a member of the global Tor network but it is not an exit node. In other words, no website or service on the Internet will see traffic coming from the public IP of our relay. This arrangement keeps us away from trouble. (Think about it: We can never know the true intentions of Tor clients, nor can we be responsible for their actions.) Having said that, we can’t stress enough that there’s always a high demand for Tor exit nodes. So if you want your contribution to the Tor network to have the highest positive impact possible, you might want to configure your relay to act as an exit relay. To do that, open /etc/tor/torrc, comment out the old ExitPolicy line and add this one:
ExitPolicy accept *:*
The above directive allows all kinds of exits, i.e., traffic destined to any TCP port, but you may selectively disallow exits to certain ports (services). See the following example:
ExitPolicy reject *:25, reject *:80, accept *:*
This means that all exits are allowed but not those to web or SMTP servers. In general, exit policies are considered first to last and the first match wins. You may split your policy in several lines, all beginning with ExitPolicy. See, for example, the default policy of any tor relay:
ExitPolicy reject *:25
ExitPolicy reject *:119
ExitPolicy reject *:135-139
ExitPolicy reject *:445
ExitPolicy reject *:563
ExitPolicy reject *:1214
ExitPolicy reject *:4661-4666
ExitPolicy reject *:6346-6429
ExitPolicy reject *:6699
ExitPolicy reject *:6881-6999
ExitPolicy accept *:*
We recommend that you read the man page of torrc for more details on exit policies.
Judging from my personal experience, if you completely allow all exits on your relay then it’s almost certain that sooner rather than later you’ll get an email from your VPS provider or your ISP. This has happened to me more than four times already. In one of those cases there were complaints about downloading of infringing content (movies and TV shows) via BitTorrent. At another time, an email from my ISP was mentioning excessive malware activity originating from my public IP at home. Each time I was the recipient of such emails, I immediately modified the exit policy of the corresponding Tor instance and continued using it as a non-exit relay. After the change of the policy, I had no further (justified) complaints from the ISP/VPS provider.
advertisment
My understanding is that even if your relay allows exits, it’s still highly improbable that you’ll get yourself in any sort of legal trouble. It is *not impossible* though, and occasionally it all depends on the law in your country and/or other legal precedents. So my recommendation is to always disallow exits or use the default exit policy. If your relay is hosted in a university, then you should probably get away by allowing all kinds of exits. In any case, always be cooperative and immediately comply to any requests from your ISP or VPS provider.
Congratulations on your new Tor relay — and have fun!

Thursday, July 24, 2014

Linux / Unix logtop: Realtime Log Line Rate Analyser

http://www.cyberciti.biz/faq/linux-unix-logtop-realtime-log-line-rate-analyser

How can I analyze line rate taking log file as input on a Linux system? How do I find the IP flooding my Apache/Nginx/Lighttpd web-server on a Debian or Ubuntu Linux?

Tutorial details
DifficultyEasy (rss)
Root privilegesYes
RequirementsNone
Estimated completion timeN/A
You need to use a tool called logtop. It is a system administrator tool to analyze line rate taking log file as input. It reads on stdin and print a constantly updated result displaying, in columns in the following format: Line number, count, frequency, and the actual line

How do install logtop on a Debian or Ubuntu based system?

Simply type the following apt-get command:
$ sudo apt-get install logtop
Sample outputs:
Reading package lists... Done
Building dependency tree
Reading state information... Done
The following NEW packages will be installed:
  logtop
0 upgraded, 1 newly installed, 0 to remove and 3 not upgraded.
Need to get 15.7 kB of archives.
After this operation, 81.9 kB of additional disk space will be used.
Get:1 http://mirrors.service.networklayer.com/ubuntu/ precise/universe logtop amd64 0.3-1 [15.7 kB]
Fetched 15.7 kB in 0s (0 B/s)
Selecting previously unselected package logtop.
(Reading database ... 114954 files and directories currently installed.)
Unpacking logtop (from .../logtop_0.3-1_amd64.deb) ...
Processing triggers for man-db ...
Setting up logtop (0.3-1) ...

Syntax

The syntax is as follows:
 
logtop [OPTIONS] [FILE]
command | logtop
command1 | filter | logtop
command1 | filter | logtop [options] [file]
 

Examples

Here are some common examples of logtop.

Show the IP address flooding your LAMP server

Type the following command:
 
tail -f www.cyberciti.biz_access.log | cut -d' ' -f1 | logtop
 
Sample outputs:
Fig.01: logtop command in action

See squid cache HIT and MISS log

 
tail -f cache.log | grep -o "HIT\|MISS" | logtop
 
To see realtime hit / miss ratio on some caching software log file, enter:
tail -f access.log | cut -d' ' -f1 | logtop -s 20000
The -s option set logtop to work with the maximum of K lines instead of 10000.

Monday, July 21, 2014

How to set up a highly available Apache cluster using Heartbeat

http://www.openlogic.com/wazi/bid/350999/how-to-set-up-a-highly-available-apache-cluster-using-heartbeat


A highly available cluster uses redundant servers to ensure maximum uptime. Redundant nodes mitigate risks related to single points of failure. Here's how you can set up a highly available Apache server cluster on CentOS.
Heartbeat provides cluster infrastructure services such as inter-cluster messaging, node memberships, IP allocation and migration, and starting and stopping of services. Heartbeat can be used to build almost any kind of highly available clusters for enterprise applications such as Apache, Samba, and Squid. Moreover, it can be coupled with load balancing software so that incoming requests are shared by all cluster nodes.
Our example cluster will consist of three servers that run Heartbeat. We'll test failover by taking down servers manually and checking whether the website they serve is still available. Here's our testing topology:
Topology The IP address against which the services are mapped needs to be reachable at all time. Normally Heartbeat would assign the designated IP address to a virtual network interface card (NIC) on the primary server for you. If the primary server goes down, the cluster will automatically shift the IP address to a virtual NIC on another of its available servers. When the primary server comes back online, it shifts the IP address back to the primary server again. This IP address is called "floating" because of its migratory properties.

Install packages on all servers

To set up the cluster, first install the prerequisites on each node using yum:
yum install PyXML cluster-glue cluster-glue-libs resource-agents
Next, download and install two Heartbeat RPM files that are not available in the official CentOS repository.
wget http://dl.fedoraproject.org/pub/epel/6/x86_64/heartbeat-3.0.4-2.el6.x86_64.rpm
wget http://dl.fedoraproject.org/pub/epel/6/x86_64/heartbeat-libs-3.0.4-2.el6.x86_64.rpm
rpm -ivh heartbeat-*
Alternatively, you can add the EPEL repository to your sources and use yum for the installs.
Heartbeat will manage starting up and stopping Apache's httpd service, so stop Apache and disable it from being automatically started:
service httpd stop
chkconfig httpd off

Set up hostnames

Now set the server hostnames by editing /etc/sysconfig/network on each system and changing the HOSTNAME line:
HOSTNAME=serverX.example.com
The new hostname will activate at the next server boot-up. You can use the hostname command to immediately activate it without restarting the server:
hostname serverX.example.com
You can verify that the hostname has been properly set by running uname -n on each server.

Configure Heartbeat

To configure Heartbeat, first copy its default configuration files from /usr to /etc/ha.d/:
cp /usr/share/doc/heartbeat-3.0.4/authkeys /etc/ha.d/
cp /usr/share/doc/heartbeat-3.0.4/ha.cf /etc/ha.d/
cp /usr/share/doc/heartbeat-3.0.4/haresources /etc/ha.d/
You must then modify all three files on all of your cluster nodes to match your requirements.
The authkeys file contains the pre-shared password to be used by the cluster nodes while communicating with each other. Each Heartbeat message within the cluster contains the password, and nodes process only those messages that have the correct password. Heartbeat supports SHA1 and MD5 passwords. In authkeys, the following directives set the authentication method as SHA1 and define the password to be used:
auth 2
2 sha1 pre-shared-password
Save the file, then give it permissions of r-- with the command chmod 600 /etc/ha.d/authkeys.
Next, in ha.cf, define timers, cluster nodes, messaging mechanisms, layer 4 ports, and other settings:
## logging ##
logfile        /var/log/ha-log
logfacility     local0hea

## timers ##
## All timers are set in seconds. Use 'ms' if you need to define time in milliseconds. ##

## heartbeat intervals ##
keepalive 2

## node is considered dead after this time ##
deadtime 15

## some servers take longer time to boot. this timer defines additional time to wait before confirming that a server is down ##
##  the recommended time for this timer is at least twice of the dead timer ##
initdead 120

## messaging parameters ##
udpport        694

bcast   eth0
## you can use multicasts or unicasts as well ##

## node definitions ##
## make sure that the hostnames match uname -n ##

node   server1.example.com
node   server2.example.com
node   server3.example.com
Finally, the file haresources contains the hostname of the server that Heartbeat considers the primary node, as well as the floating IP address. It is vital that this file be identical across all servers. As long as the primary node is up, it serves all requests; Heartbeat stops the highly available service on all other nodes. When Heartbeat detects that that primary node is down, it automatically starts the service on the next available node in the cluster. When the primary node comes back online, Heartbeat sets it to take over again and serve all requests. Finally, this file contains the name of the script that is responsible for the highly available service: httpd in this case. Other possible values might be squid, smb, nmb, or postfix, mapping to the name of the service startup script typically located in the /etc/init.d/ directory.
In haresources, define server1.example.com to be the primary server, 192.168.56.200 to be the floating IP address, and httpd to be the highly available service. You do not need to create any interface or manually assign the floating IP address to any interface – Heartbeat takes care of that for you:
server1.example.com 192.168.56.200 httpd
After the configuration files are ready on each of the servers, start the Heartbeat service and add it to system startup:
service heartebeat start
chkconfig heartbeat on
You can keep an eye on the Heartbeat log with the command tailf /var/log/ha-log.
Heartbeat can be used to for multiple services. For example, the following directive in haresources would make Heartbeat manage both Apache and Samba services:
server1.example.com 192.168.56.200 httpd smb nmb
However, unless you're also running a cluster resource manager (CRM) such as Pacemaker, I do not recommend using Heartbeat to provide mulitple services in a single cluster. Without Pacemaker, Heartbeat monitors cluster nodes in layer 3 using IP addresses. As long as an IP address is reachable, Heartbeat is oblivious to any crashes or difficulties that services may be facing on a server node.

Testing

Once Heartbeat is up and running, test it out. Create separate index.html files on all three servers so you can see which server is serving the page. Browse to 192.168.56.200 or, if you have DNS set up, its domain name equivalent. The page should be loaded from server1.example.com, and you can check this by looking at the Apache log file in server1. Try refreshing the page and verify whether the page is being loaded from the same server each time.
If this goes well, test failover by stopping the Heartbeat service on server1.example.com. The floating IP address should be migrated to server 2, and the page should be loaded from there. A quick look into server2 Apache log should confirm the fact. If you stop the service on server2 as well, the web pages will be loaded from server3.example.com, the only available node in the cluster. When you restart the services on server1 and server2, the floating IP address should migrate from the active node to server1, per the setup in haresources.
As you can see, it's easy to set up a highly available Apache cluster under CentOS using Heartbeat. While we used three servers, Heartbeat should work with more or fewer nodes as well. Heartbeat has no constraint on the number of nodes, so you can scale the setup as you need.

Friday, July 18, 2014

Counting lines of code with cloc

http://linuxconfig.org/counting-lines-of-code-with-cloc

Are you working on a project and need to submit your progress, statistics or perhaps you need to calculate a value of your code? cloc is a powerful tool that allows you to count all lines of your code, exclude comment lines and white space and even sort it by programming language.

cloc is available for all major Linux distributions. To install cloc on your system simply install cloc package from system's package repository:
DEBIAN/UBUNTU:
# apt-get install cloc
FEDORA/REDHAT/CENTOS
# yum install cloc
cloc work on per file or per directory basis. To count the lines of the code simply point cloc to a directory or file. Let's create my_project directory with single bash script:
$ mkdir my_project
$ cat my_project/bash.sh 
#!/bin/bash

echo "hello world"
Let cloc to count the lines of our code:
$ cloc my_project/bash.sh 
       1 text file.
       1 unique file.                              
       0 files ignored.

http://cloc.sourceforge.net v 1.60  T=0.00 s (262.8 files/s, 788.4 lines/s)
-------------------------------------------------------------------------------
Language                     files          blank        comment           code
-------------------------------------------------------------------------------
Bourne Shell                     1              1              0              2
-------------------------------------------------------------------------------
Let's add another file by this time with perl code and count the line of code by pointing it to the entire directory rather then just a single file:
$ cat my_project/perl.pl
#!/usr/bin/perl

print "hello world\n"
$ ls my_project/
bash.sh  perl.pl
$ cloc my_project/
       2 text files.
       2 unique files.                              
       0 files ignored.

http://cloc.sourceforge.net v 1.60  T=0.01 s (287.8 files/s, 863.4 lines/s)
-------------------------------------------------------------------------------
Language                     files          blank        comment           code
-------------------------------------------------------------------------------
Perl                             1              1              0              2
Bourne Shell                     1              1              0              2
-------------------------------------------------------------------------------
SUM:                             2              2              0              4
-------------------------------------------------------------------------------
In the next example we will print results for each file separately on each line. This can be done by the use of --by-file option:
$ cloc --by-file my_project/
       2 text files.
       2 unique files.                              
       0 files ignored.

http://cloc.sourceforge.net v 1.60  T=0.01 s (149.5 files/s, 448.6 lines/s)
--------------------------------------------------------------------------------
File                              blank        comment           code
--------------------------------------------------------------------------------
my_project/perl.pl                    1              0              2
my_project/bash.sh                    1              0              2
--------------------------------------------------------------------------------
SUM:                                  2              0              4
--------------------------------------------------------------------------------

cloc can obtain count of all code lines also from a compressed file. In the next example we count code lines of entire joomla project, provided the we have already downloaded its zipped source code:
$ cloc /tmp/Joomla_3.3.1-Stable-Full_Package.zip
count lines of code - compressed file
Count lines of currently running kernel's source code ( redhat/fedora ):
$ cloc /usr/src/kernels/`uname -r`
count lines of kernel source code
For more information and options see cloc manual page man cloc

Wednesday, July 16, 2014

How to check RPM package dependencies on Fedora, CentOS or RHEL

http://xmodulo.com/2014/07/check-rpm-package-dependencies-fedora-centos-rhel.html

A typical RPM package on Red Hat-based systems requires all its dependent packages be installed to function properly. For end users, the complexity of such RPM dependency is hidden by package managers (e.g., yum or DNF) during package install/upgrade/removal process. However, if you are a sysadmin or a RPM maintainer, you need to be well-versed in RPM dependencies to maintain run-time environment for the system or roll out up-to-date RPM specs.
In this tutorial, I am going to show how to check RPM package dependencies. Depending on whether a package is installed or not, there are several ways to identify its RPM dependencies.

Method One

One way to find out RPM dependencies for a particular package is to use rpm command. The following command lists all dependent packages for a target package.
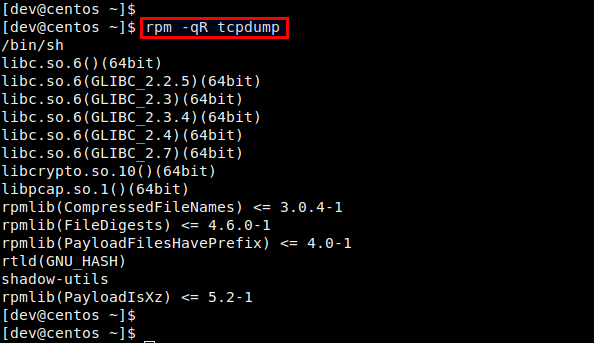
$ rpm -qR

Note that this command will work only if the target package is already installed. If you want to check package dependencies for any uninstalled package, you first need to download the RPM package locally (no need to install it).
To download a RPM package without installing it, use a command-line utility called yumdownloader. Install yumdownloader as follows.
$ sudo yum install yum-utils
Now let's check RPM depenencies of a uninstalled package (e.g., tcpdump). First download the package in the current folder with yumdownloader:
$ yumdownloader --destdir=. tcpdump
Then use rpm command with "-qpR" options to list dependencies of the downloaded package.
# rpm -qpR tcpdump-4.4.0-2.fc19.i686.rpm

Method Two

You can also get a list of dependencies for a RPM package using repoquery tool. repoquery works whether or not a target package is installed. This tool is included in yum-utils package.
$ sudo yum install yum-utils
To show all required packages for a particular package:
$ repoquery --requires --resolve

For repoquery to work, your computer needs network connectivity since repoquery pulls information from Yum repositories.

Method Three

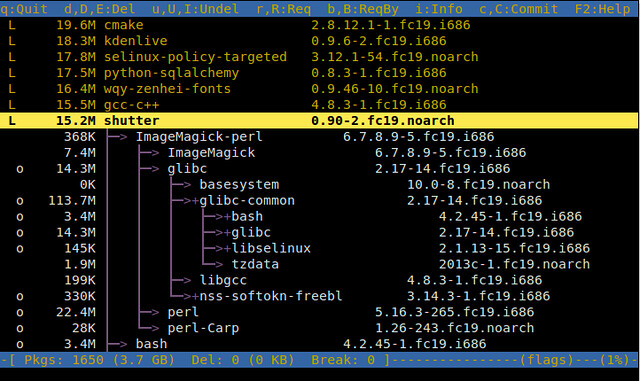
The third method to show RPM package dependencies is to use rpmreaper tool. Originally this tool is developed to clean up unnecessary packages and their dependencies on RPM-based systems. rpmreaper has an ncurses-based intuitive interface for browsing installed packages and their dependency trees.
To install rpmrepater, use yum command. On CentOS, you need to set up EPEL repo first.
$ sudo yum install rpmreaper
To browser RPM dependency trees, simply run:
$ rpmreaper

The rpmrepater interface will show you a list of all installed packages. You can navigate the list using up/down arrow keys. Press "r" on a highlighted package to show its dependencies. You can expand the whole dependency tree by recursively pressing "r" keys on individual dependent packages. The "L" flag indicates that a given package is a "leaf", meaning that no other package depends on this package. The "o" flag implies that a given package is in the middle of dependency chain. Pressing "b" on such a package will show you what other packages require the highlighted package.

Method Four

Another way to show package dependencies on RPM-based systems is to use rpmdep which is a command-line tool for generating a full package dependency graph of any installed RPM package. The tool analyzes RPM dependencies, and produce partially ordered package lists from topological sorting. The output of this tool can be fed into dotty graph visualization tool to generate a dependency graph image.
To install rpmdep and dotty on Fedora:
$ sudo yum install rpmorphan graphviz
To install the same tools on CentOS:
$ wget http://downloads.sourceforge.net/project/rpmorphan/rpmorphan/1.14/rpmorphan-1.14-1.noarch.rpm
$ sudo rpm -ivh rpmorphan-1.14-1.noarch.rpm
$ sudo yum install graphviz
To generate and plot a dependency graph of a particular installed package (e.g., gzip):
$ rpmdep.pl -dot gzip.dot gzip
$ dot -Tpng -o output.png gzip.dot

So far in this tutorial, I demonstrate several ways to check what other packages a given RPM package relies on. If you want to know more about .deb package dependencies for Debian-based systems, you can refer to this guide instead.

Linux Terminal: inxi – a full featured system information script

http://linuxaria.com/pills/linux-terminal-inxi-a-full-featured-system-information-script

Sometimes it’s useful to know which components you are using on a GNU/Linux computer or server, you can go with the long way, taking a look at the boot message for all the hardware discovered, use some terminal commands such as lsusb,lspci or lshw or some graphical tools such as hardinfo (my favourite graphical tool) or Inex/CPU-G.
But I’ve discovered on my Linux Mint, that, by default, I’ve now a new option: inxi
inxi it’s a full featured system information script wrote in bash, that easily will show on a terminal all the info of your system.


Inxi comes pre-installed with SolusOS, Crunchbang, Epidemic, Mint, AntiX and Arch Linux but as it is a bash script it works on a lot of other distributions. Although it is intended for use with chat applications like IRC it also works from a shell and provides an abundance of information, It is is a fork of locsmif’s largely unmaintained yet very clever, infobash script. inxi is co-developed, a group project, primarily with trash80 on the programming side.
Inxi works on Konversation, Xchat, irssi, Quassel, as well as on most other IRC clients. Quassel includes (usually an older version of) inxi.
Installation is as easy as downloading and chmoding a file.

Installation

Inxi is present in the default repository of most distros so you can install it (if you are missing it) with these commands:
# Ubuntu/Debian users
$ sudo apt-get install inxi
 
# CentOS/Fedora users
$ sudo yum install inxi
 
# Arch
$ sudo pacman -s inxi
If inxi is not present on your distro, then you can install it by following the instructions here
https://code.google.com/p/inxi/wiki/Installation

Basic Usage

Just open a terminal (with a normal user) and give the command inxi, this will show up the basic information of your system (in colors !!), something like this:
linuxaria@mint-desktop ~ $ inxi
 
CPU~Dual core Intel Pentium CPU G620 (-MCP-) clocked at 1600.000 Mhz Kernel~3.13.0-24-generic x86_64 Up~8:20 Mem~2814.4/7959.2MB HDD~644.1GB(16.8% used) Procs~221 Client~Shell inxi~1.8.4
Ok, interesting but what if you would like some more info ?
Don’t worry the commands it’s full of options, some are:
-A Show Audio/sound card information.
-C Show full CPU output, including per CPU clockspeed.
-D Show full hard Disk info, not only model, ie: /dev/sda ST380817AS 80.0GB. See also -x and -xx.
-F Show Full output for inxi. Includes all Upper Case line letters, plus -s and -n.
Does not show extra verbose options like -x -d -f -u -l -o -p -t -r unless you use that argument.
-G Show Graphic card information (card, x type, resolution, glx renderer, version).
-I Show Information: processes, uptime, memory, irc client, inxi version.
-l Show partition labels. Default: short partition -P. For full -p output, use: -pl (or -plu).
-n Show Advanced Network card information. Same as -Nn. Shows interface, speed, mac id, state, etc.
-N Show Network card information. With -x, shows PCI BusID, Port number.
And this is just a short list of all the options you can get, as alternatively you could use the -v (verbosity) flag:
-v Script verbosity levels. Verbosity level number is required. Should not be used with -b or -F
Supported levels: 0-7 Example: inxi -v 4
0 – Short output, same as: inxi
1 – Basic verbose, -S + basic CPU + -G + basic Disk + -I.
2 – Adds networking card (-N), Machine (-M) data, shows basic hard disk data (names only),
and, if present, basic raid (devices only, and if inactive, notes that). similar to: inxi -b
3 – Adds advanced CPU (-C), network (-n) data, and switches on -x advanced data option.
4 – Adds partition size/filled data (-P) for (if present):/, /home, /var/, /boot
Shows full disk data (-D).
5 – Adds audio card (-A); sensors (-s), partition label (-l) and UUID (-u), short form of optical drives,
standard raid data (-R).
6 – Adds full partition data (-p), unmounted partition data (-o), optical drive data (-d), full raid.
7 – Adds network IP data (-i); triggers -xx.
This is an example of output with -v 7
linuxaria@mint-desktop ~ $ inxi -v7 -c 0
System:    Host: mint-desktop Kernel: 3.13.0-24-generic x86_64 (64 bit, gcc: 4.8.2) 
           Desktop: Xfce 4.11.6 (Gtk 2.24.23) Distro: Linux Mint 17 Qiana
Machine:   Mobo: ASRock model: H61M-HVS Bios: American Megatrends version: P1.50 date: 11/04/2011
CPU:       Dual core Intel Pentium CPU G620 (-MCP-) cache: 3072 KB flags: (lm nx sse sse2 sse3 sse4_1 sse4_2 ssse3 vmx) bmips: 10377 
           Clock Speeds: 1: 1600.00 MHz 2: 1600.00 MHz
Graphics:  Card: Advanced Micro Devices [AMD/ATI] Park [Mobility Radeon HD 5430] bus-ID: 01:00.0 
           X.Org: 1.15.1 drivers: ati,radeon (unloaded: fbdev,vesa) Resolution: 1920x1080@60.0hz 
           GLX Renderer: Gallium 0.4 on AMD CEDAR GLX Version: 3.0 Mesa 10.1.0 Direct Rendering: Yes
Audio:     Card-1: Intel 6 Series/C200 Series Chipset Family High Definition Audio Controller driver: snd_hda_intel bus-ID: 00:1b.0
           Card-2: Advanced Micro Devices [AMD/ATI] Cedar HDMI Audio [Radeon HD 5400/6300 Series] driver: snd_hda_intel bus-ID: 01:00.1
           Sound: Advanced Linux Sound Architecture ver: k3.13.0-24-generic
Network:   Card-1: Realtek RTL8101E/RTL8102E PCI Express Fast Ethernet controller 
           driver: r8169 ver: 2.3LK-NAPI port: d000 bus-ID: 03:00.0
           IF: eth0 state: down mac: bc:5f:f4:12:18:d3
           Card-2: D-Link DWA-125 Wireless N 150 Adapter(rev.A3) [Ralink RT5370] 
           driver: rt2800usb ver: 2.3.0 usb-ID: 2001:3c19
           IF: wlan0 state: up mac: 28:10:7b:42:3e:82
           WAN IP: 87.1.60.128 IF: eth0 ip: N/A ip-v6: N/A IF: wlan0 ip: 192.168.0.4 ip-v6: fe80::2a10:7bff:fe42:3e82 
Drives:    HDD Total Size: 644.1GB (16.8% used) 1: id: /dev/sda model: ST500DM002 size: 500.1GB serial: W2AGA8A2 
           2: id: /dev/sdb model: SanDisk_SDSSDP12 size: 126.0GB serial: 134736401617 
           3: id: /dev/sdd model: SD/MMC size: 2.0GB serial: 058F63646476-0:0 
           4: USB id: /dev/sdc model: DataTraveler_G3 size: 16.0GB serial: 001CC0EC30C8BAB085FE002F-0:0 
           Optical: /dev/sr0 model: N/A rev: N/A dev-links: cdrom
           Features: speed: 12x multisession: yes audio: yes dvd: yes rw: cd-r,cd-rw,dvd-r,dvd-ram state: N/A
Partition: ID: / size: 25G used: 5.1G (22%) fs: ext4 dev: /dev/sdb1 
           label: N/A uuid: 133f805a-3963-42ef-a3b4-753db11789df
           ID: /ssd size: 91G used: 24G (28%) fs: ext4 dev: /dev/sdb2 
           label: N/A uuid: 4ba69219-75e4-44cc-a2ee-ccefddb82718
           ID: /home size: 416G used: 60G (16%) fs: btrfs dev: /dev/sda6 
           label: N/A uuid: 20d66995-8107-422c-a0d9-f731e1e02078
           ID: /media/linuxaria/3634-3330 size: 1.9G used: 1.9G (99%) fs: vfat dev: /dev/sdd1 
           label: N/A uuid: 3634-3330
           ID: /media/linuxaria/KINGSTON size: 15G used: 11G (70%) fs: vfat dev: /dev/sdc1 
           label: KINGSTON uuid: 25B5-AD6B
           ID: swap-1 size: 4.00GB used: 0.00GB (0%) fs: swap dev: /dev/sda5 
           label: N/A uuid: 85e49559-db67-41a6-9741-4efc3f2aae1f
RAID:      System: supported: N/A
           No RAID devices detected - /proc/mdstat and md_mod kernel raid module present
           Unused Devices: none
Unmounted: ID: /dev/sda1 size: 50.00G label: N/A uuid: a287ff9c-1eb5-4234-af5b-ea92bd1f7351 
           ID: /dev/sr0 size: 1.07G label: N/A uuid: N/A 
Sensors:   System Temperatures: cpu: 38.0C mobo: N/A gpu: 52.0 
           Fan Speeds (in rpm): cpu: N/A 
Info:      Processes: 219 Uptime: 8:26 Memory: 2611.9/7959.2MB Runlevel: 2 Gcc sys: 4.8.2 Client: Shell inxi: 1.8.4
As you can see this output show a looot more information, you can get a long output also with the option -F (full output).
As last thing, if you are using an Xterm you can choose which color scheme use, and to see which one are available just use the command: inxi -c 94, you’ll get an output similar to this one:
inxi color
Inxi in action:


Tuesday, July 15, 2014

Georgia Tech researchers enlist owners of websites -- and website users -- via Encore project

http://www.networkworld.com/article/2450108/security0/open-source-tool-could-sniff-out-most-heavily-censored-websites-georgia-tech-nsf-google.html

Georgia Tech researchers are seeking the assistance of website operators to help better understand which sites are being censored and then figure out how to get around such restricted access by examining the data collected.
The open source Encore [Enabling Lightweight Measurements of Censorship with Cross-Origin Requests] tool involves website operators installing a single line of code onto their sites, and that in turn will allow the researchers to determine whether visitors to these sites are blocked from visiting other sites around the world known to be censored. The researchers are hoping to enlist a mix of small and big websites, and currently it is running on about 10 of them.
Georgia Tech Encore tool Georgia Tech
The code works in the background after a page is loaded and Georgia Tech’s team claims the tool won’t slow performance for end users or websites, nor does it track browsing behavior.
+Also on NetworkWorld: 13 of today's Coolest Network Research Projects +
Featured Resource
Presented by Dell Inc.
Improvements in 10GbE technology, lower pricing, and improved performance make 10GbE for the mid-market
Learn More
"Web censorship is a growing problem affecting users in an increasing number of countries," said Sam Burnett, the Georgia Tech Ph.D. candidate who leads the project, in a statement. "Collecting accurate data about what sites and services are censored will help educate users about its effects and shape future Internet policy discussions surrounding Internet regulation and control."
(Burnett’s adviser is Nick Feamster, whose Internet censorship research we’ve written about in the past. I exchanged email with Feamster to gain additional insight into this new research.)
End users won’t even know the baseline data measurement is taking place, which of course when you’re talking about censorship and privacy, can be a sticky subject. Facebook learned that recently when disclosures erupted regarding its controversial secret study of users’ moods. The Georgia Tech researchers in an FAQ say their tool can indicate to users that their browsers are conducting measurements, and that users can opt out.
"Nothing would pop up [in an end user's browser] but a webmaster has an option to make the measurements known/visible," Feamster says.
"They also assure potential Encore users that the list of censored sites compiled by Herdict does not include pornographic ones, so an end user’s browser won’t be directed to such sites in the name of research.
Encore, which is being funded by a National Science Foundation grant on censorship measurement and circumvention as well as via a Google Focused Research Award, has been submitted in hopes of presenting it at the Internet Measurement Conference in November in Vancouver.

How To Enable Storage Pooling And Mirroring Using Btrfs For Linux

http://www.makeuseof.com/tag/how-to-enable-storage-pooling-and-mirroring-using-btrfs-for-linux

If you have multiple hard drives in your Linux system, you don’t have to treat them all as different storage devices. With Btrfs, you can very easily create a storage pool out of those hard drives.
Under certain conditions, you can even enable mirroring so you won’t lose your data due to hard drive failure. With everything set up, you can just throw whatever you want into the pool and make the most use of the storage space you have.
There isn’t a GUI configuration utility that can make all of this easier (yet), but it’s still pretty easy to do with the command line. I’ll walk you through a simple setup for using several hard drives together.

What’s Btrfs?

Btrfs (called B-tree filesystem, “Butter FS”, or “Better FS”) is an upcoming filesystem that incorporates many different features at the filesystem level normally only available as separate software packages. While Btrfs has many noteworthy features (such as filesystem snapshots), the two we’re going to take a look at in this article are storage pooling and mirroring.
If you’re not sure what a filesystem is, take a look at this explanation of a few filesystems for Windows. You can also check out this nice comparison of various filesystems to get a better idea of the differences between existing filesystems.
Btrfs is still considered “not stable” by many, but most features are already stable enough for personal use — it’s only a few select features where you might encounter some unintended results.
While Btrfs aims to be the default filesystem for Linux at some point in the future, it’s still best to use ext4 for single hard drive setups or for setups that don’t need storage pooling and mirroring.

Pooling Your Drives

For this example, we’re going to use a four hard drive setup. There are two hard drives (/dev/sdb and /dev/sdc) with 1TB each, and two other hard drives (/dev/sdd and /dev/sde) with 500GB for a total of four hard drives with a total of 3TB of storage.
You can also assume that you have another hard drive (/dev/sda) of some arbitrary size which contains your bootloader and operating system. We’re not concerning ourselves about /dev/sda and are solely combining the other four hard drives for extra storage purposes.

Creating A Filesystem

btrfs gparted   How To Enable Storage Pooling And Mirroring Using Btrfs For Linux

To create a Btrfs filesystem on one of your hard drives, you can use the command:sudo mkfs.btrfs /dev/sdb
Of course, you can replace /dev/sdb with the actual hard drive you want to use. From here, you can add other hard drives to the Btrfs system to make it one single partition that spans across all hard drives that you add. First, mount the first Btrfs hard drive using the command:
sudo mount /dev/sdb /mnt
Then, run the commands:
sudo mkfs.btrfs /dev/sdc mkfs.btrfs /dev/sdd mkfs.btrfs /dev/sde
Now, you can add them to the first hard drive using the commands:
sudo btrfs device add /dev/sdc /mnt btrfs device add /dev/sdd /mnt btrfs device add /dev/sde /mnt
If you had some data stored on the first hard drive, you’ll want the filesystem to balance it out among all of the newly added hard drives. You can do this with the command:
sudo btrfs filesystem balance /mnt
Alternatively, if you know before you even begin that you want a Btrfs filesystem to span across all hard drives, you can simply run the command:
sudo mkfs.btrfs -d single /dev/sdb /dev/sdc /dev/sdd /dev/sde
Of course this is much easier, but you’ll need to use the method mentioned above if you don’t add them all in one go.
You’ll notice that I used a flag: “-d single”. This is necessary because I wanted a RAID 0 configuration (where the data is split among all the hard drives but no mirroring occurs), but the “single” profile is needed when the hard drives are different sizes. If all hard drives were the same size, I could instead use the flag “-d raid0″. The “-d” flag, by the way, stands for data and allows you to specify the data configuration you want. There’s also an “-m” flag which does the exact same thing for metadata.
Besides this, you can also enable RAID 1 using “-d raid1″ which will duplicate data across all devices, so using this flag during the creation of the Btrfs filesystem that spans all hard drives would mean that you only get 500GB of usable space, as the three other hard drives are used for mirroring.
Lastly, you can enable RAID 10 using “-d raid10″. This will do a mix of both RAID 0 and RAID 1, so it’ll give you 1.5TB of usable space as the two 1TB hard drives are paired in mirroring and the two 500GB hard drives are paired in mirroring.

Converting A Filesystem

btrfs harddiskstack   How To Enable Storage Pooling And Mirroring Using Btrfs For Linux

If you have a Btrfs filesystem that you’d like to convert to a different RAID configuration, that’s easily done. First, mount the filesystem (if it isn’t already) using the command:sudo  mount /dev/sdb1 /mnt
Then, run the command:
sudo btrfs balance start -dconvert=raid1 -mconvert=raid1 /mnt
This will change the configuration to RAID 1, but you can replace that with whatever configuration you want (so long as it’s actually allowed — for example, you can’t switch to RAID 10 if you don’t have at least four hard drives). Additionally, the -mconvert flag is optional if you’re just concerned about the data but not the metadata.

If Hard Drive Failure Occurs

If a hard drive fails, you’ll need to remove it from the filesystem so the rest of the pooled drives will work properly. Mount the filesystem with the command:
sudo mount -o degraded /dev/sdb /mnt
Then fix the filesystem with:
sudo btrfs device delete missing /mnt
If you didn’t have RAID 1 or RAID 10 enabled, any data that was on the failed hard drive is now lost.

Removing A Hard Drive From The Filesystem

Finally, if you want to remove a device from a Btrfs filesystem, and the filesystem is mounted to /mnt, you can do so with the command:
sudo btrfs device delete /dev/sdc /mnt
Of course, replace /dev/sdc with the hard drive you want to remove. This command will take some time because it needs to move all of the data off the hard drive being removed, and will likewise fail if there’s not enough room on the other remaining hard drives.

Automatic Mounting

btrfs fstab   How To Enable Storage Pooling And Mirroring Using Btrfs For Linux

If you want the Btrfs filesystem to be mounted automatically, you can place this into your /etc/fstab file:sudo /dev/sdb /mnt btrfs device=/dev/sdb,device=/dev/sdc,device=/dev/sdd,device=/dev/sde 0 0

Mount Options

One more bonus tip! You can optimize Btrfs’s performance in your /etc/fstab file under the mount options for the Btrfs filesystem. For large storage arrays, these options are best: compress-force=zlib,autodefrag,nospace_cache. Specifically, compress=zlib will compress all the data so that you can make the most use of the storage space you have. For the record, SSD users can use these options: noatime,compress=lzo,ssd,discard,space_cache,autodefrag,inode_cache. These options go right along with the device specifications, so a complete line in /etc/fstab for SSD users would look like:
sudo /dev/sdb /mnt btrfs device=/dev/sdb,device=/dev/sdc,device=/dev/sdd,device=/dev/sde,
noatime,compress=lzo,ssd,discard,space_cache,autodefrag,inode_cache 0 0

How Big Is Your Storage Pool?

Btrfs is a fantastic option for storage pooling and mirroring that is sure to become more popular once it is deemed completely stable. It also wouldn’t hurt for there to be a GUI to make configuration easier (besides in some distribution installers), but the commands you have to use in the terminal are easy to grasp and apply.
What’s the biggest storage pool you could make? Do you think storage pools are worthwhile? Let us know in the comments!