Wednesday, September 9, 2026

SAW: Build Structured Multi-Agent AI Workflows on Linux

https://www.tecmint.com/safe-agentic-workflow-linux

SAW: Build Structured Multi-Agent AI Workflows on Linux

Vulnerability Manager Plus
Learn how to install safe-agentic-workflow (SAW) on Linux, add it to a project alongside Claude Code, and use it to process a real task through its multi-agent workflow with Node.js and Git.

If you ask Claude Code to fix a single bug, it will usually do a good job. But as projects grow and you start handling multiple bugs across different files over several days, things can become inconsistent.

One agent might skip running tests, another might make changes you didn’t ask for, and it can be difficult to track who approved what. SAW is designed to solve these problems by adding a clear, structured workflow instead of relying on increasingly complex prompts.

TecMint Weekly Newsletter
Get the Learn Linux 7 Days Crash Course free when you join 34,000+ Linux professionals reading every Thursday.

What SAW Actually Is

SAW, short for SAFe Agentic Workflow, is a structured workflow that works alongside Claude Code. Instead of relying on a single AI agent to handle everything, SAW divides the work into clearly defined roles. It does this by adding a collection of Claude Code slash commands, agent definitions, and hooks to your project’s .claude directory.

Each agent has a specific responsibility. For example, the BSA (Business Systems Analyst) creates the requirements and acceptance criteria, Developer agents implement the changes, the QAS (Quality Assurance Specialist) reviews and approves the work before it moves forward, and the RTE (Release Train Engineer) coordinates the overall workflow and pull request.

The biggest advantage of SAW is that it prevents agents from making assumptions. If a task doesn’t include clear acceptance criteria, the Developer agent won’t start working on it. Instead, it sends the task back to the BSA to clarify the requirements.

This simple approval gate helps keep everyone working toward the same goal and reduces unexpected changes.

For this guide, we tested SAW on Ubuntu 26.04 LTS and RHEL 10. However, because SAW mainly consists of shell scripts and Markdown files stored in your project’s repository, it can run on almost any modern Linux distribution as long as Git and Node.js are installed.

Reload Your Shell

If you’ve just updated your shell configuration, reload it so the changes take effect:

source ~/.bashrc

This command reloads your current shell session without requiring you to log out or open a new terminal window.

Want to learn Claude Code from the ground up? Check out our Claude Code for Linux course, where you’ll learn to install, configure, and use Claude Code to build, debug, and automate real-world development workflows.

Prerequisites

Before you install SAW, make sure you have Git, Node.js, and Claude Code installed.

  • Git is used to clone the SAW repository and manage your project.
  • Node.js is required because SAW uses Node-based tools and scripts.
  • Claude Code is the AI coding assistant that SAW is designed to work with.

Install Git and Build Tools on Ubuntu/Debian

sudo apt update
sudo apt install -y git curl build-essential

Install Git and Build Tools on RHEL/Rocky Linux

sudo dnf install -y git curl gcc make

The sudo command runs a command with administrator (root) privileges. Installing software writes files to system directories that a regular user cannot modify, so these commands require sudo.

If you receive a Permission denied error during installation, make sure you’re running the command with sudo.

Install NVM (Node Version Manager)

SAW specifies the Node.js version it expects in a file named .nvmrc. Instead of using the Node.js version provided by your Linux distribution, it’s better to install NVM (Node Version Manager).

NVM makes it easy to install and switch between different Node.js versions.
Install NVM with:

curl -o- https://raw.githubusercontent.com/nvm-sh/nvm/v0.40.1/install.sh | bash

After the installation finishes, reload your shell so the nvm command becomes available:

source ~/.bashrc

This command reloads your current shell configuration without requiring you to open a new terminal window.

If SAW’s automation has made your workflow easier, share this guide with a teammate who’s still copy-pasting AI-generated code by hand.

Step 1: Clone the SAW Repository

The first step is to clone the SAW repository. This creates a local copy that you’ll use to copy the required files into your own project. You won’t be developing directly inside this cloned directory.

Clone the repository and switch to it:

git clone https://github.com/bybren-llc/safe-agentic-workflow.git
cd safe-agentic-workflow
nvm install
nvm use

The nvm< install command reads the .nvmrc file in the repository and installs the required Node.js version if it isn’t already available on your system. The nvm use command then switches your current shell session to that version so SAW runs with the environment it was designed for.

Here’s what each command does:

  • git clone downloads the complete SAW repository, including configuration folders such as .claude/, .gemini/, .codex/, and .cursor/ for the supported AI providers.
  • cd safe-agentic-workflow changes your current directory to the cloned repository so the remaining commands run in the correct location.
  • nvm install checks the .nvmrc file and installs the required Node.js version if it’s not already installed.
  • nvm use switches your current terminal session to use that Node.js version.

Step 2: Copy SAW into Your Project

SAW isn’t installed like a typical software package. Instead, you copy its configuration files into the project where you want to use it. If you’re using Claude Code, you’ll copy the .claude directory into your project’s root directory.

Run the following command:

cp -r .claude/ /path/to/your-project/.claude/
cd /path/to/your-project

Replace /path/to/your-project/ with the actual path to your project. Throughout this guide, placeholders enclosed in angle brackets, such as, represent values that you should replace with your own.

The first command copies the entire .claude directory, including the agent definitions, slash commands, and workflow files, into your project. The second command changes to your project’s directory so you can continue the setup from there.

If your team uses another supported AI coding assistant, you can copy the corresponding configuration directory instead. For example, copy .gemini/ for Gemini CLI or .cursor/ for Cursor using the same approach.

Step 3: Customize the Project Placeholders

The SAW templates include placeholder values such as {{TICKET_PREFIX}} and {{PROJECT_NAME}}. Before you start using the workflow, replace these placeholders with values that match your project.

Run the setup script:

bash scripts/setup-template.sh

The script will prompt you for a few details, including your project name and a ticket prefix. For example, if your issue tracker uses ticket IDs likeTEC-123, enter TEC as the ticket prefix.

After the script finishes, open the .claude/SETUP.md file and verify that all placeholders have been replaced. If you still see values such as {{TICKET_PREFIX}} or {{PROJECT_NAME}}, update them before continuing.

Leaving placeholder values in the configuration can cause agent prompts and handoff templates to contain incomplete or incorrect information later.

If you’ve ever seen an AI agent make up requirements because the original task wasn’t clear, you’ll appreciate why SAW exists. Its stop-the-line workflow forces missing requirements to be clarified before any code is written, helping keep every agent focused on the work you actually asked for.

If you found this guide helpful, share it with someone who wants more predictable and reliable AI-assisted development.

Step 4: Run Your First Ticket

After copying and configuring SAW, you’re ready to use it with Claude Code.

Start Claude Code from your project’s root directory:

claude

When the Claude Code session opens, start working on a ticket using the slash command provided by SAW:

/start-work TEC-123

Replace TEC-123 with the actual ticket ID from your project.

When you run this command, the BSA (Business Systems Analyst) agent starts first. Its job is to check whether the ticket includes clear acceptance criteria and a defined “Definition of Done.”

If either of these is missing, the workflow stops and asks you to add the required information before any implementation begins.

This behavior is intentional. Instead of letting an AI guess what needs to be done, SAW requires the task to be clearly defined first. This helps reduce mistakes and keeps the implementation aligned with the original requirements.

Once the ticket has complete acceptance criteria, the appropriate Developer agent begins implementing the changes. After finishing, it hands the work over with a “Ready for QAS” status.

The QAS (Quality Assurance Specialist) agent then reviews the implementation against the same acceptance criteria before the changes can move forward to a pull request.

This structured workflow helps ensure that every stage of the task is reviewed before it is considered complete.

If your team has ever shipped a fix that accidentally skipped testing, share this guide with your team lead before it happens again.

Key SAW Commands

As you work with SAW, you’ll mainly use the following slash commands to manage tickets and move them through the workflow.

Command Purpose
/start-work TEC-123 Starts work on a ticket and checks that it has valid acceptance criteria and a Definition of Done (DoD) before implementation begins.
/pre-pr Runs the required validation checks before creating or submitting a pull request.
/end-work Ends the current work session and cleans up the workflow state.
/check-workflow Shows the current status of a ticket and where it is in the SAW workflow.

These commands provide a consistent way to start work, validate changes, track progress, and finish tasks without manually managing the workflow.

If you’d like to learn more about using Claude Code, including agent orchestration, workflow automation, and practical examples, check out the Claude Code for Linux Sysadmins course, which covers the complete workflow from setup to advanced usage.

Running Agent Teams on a Remote Server

For longer or more complex projects, you can run SAW’s agent teams on a remote Linux server instead of your local machine. The dark-factory directory included with SAW is designed for this purpose.

It uses tmux to keep multiple agent sessions running in the background, even if you disconnect from the server.

This setup is useful for long-running tasks that may take hours to complete or when you don’t want to keep your laptop powered on throughout the process.

DigitalOcean offers cloud VPS plans starting at $4/month.

TecMint Pro members can also receive $200 in free credits to create their first server and follow along with this guide. We may earn a commission at no additional cost to you.

If you found SAW’s dark-factory tmux setup useful for running agents unattended, share this guide with others who are looking for a reliable way to keep AI agent workflows running on a remote Linux server without having to monitor a terminal continuously.

Common Mistake: Skipping the Manifest During Updates

A common mistake is updating SAW without using its manifest-based synchronization process. Older versions of SAW were typically updated by adding the repository as a Git remote and manually comparing changes with git diff.

While that approach still works in SAW v2.10.0, it doesn’t track which files you’ve customized. As a result, your local changes can be accidentally overwritten during an update.

Instead, initialize and use the manifest-based sync:

./scripts/sync-claude-harness.sh init
./scripts/sync-claude-harness.sh manifest init --yes
./scripts/sync-claude-harness.sh sync --version v2.10.0 --dry-run

Here’s what each command does:

  • ./scripts/sync-claude-harness.sh init initializes the synchronization environment.
  • ./scripts/sync-claude-harness.sh manifest init --yes creates a manifest that records the managed files in your project.
  • ./scripts/sync-claude-harness.sh sync --version v2.10.0 --dry-run previews the changes required to update to version v2.10.0 without modifying any files.

The --dry-run option is especially important because it shows exactly what will be updated before any changes are made. Review the output first, then rerun the sync command without --dry-run when you’re satisfied with the proposed changes.

What SAW Won’t Do for You

While SAW adds structure to AI-assisted development, it isn’t a complete project management solution or a replacement for good engineering practices.

According to the project’s documentation, SAW is primarily designed and tested for software development workflows. Support for other use cases, such as marketing, content creation, or research workflows, is available but hasn’t been validated as extensively in real-world production environments.

Similarly, SAW supports multiple AI coding assistants, including Claude Code, Gemini CLI, Codex CLI, and Cursor.

However, the Claude Code integration is currently the most mature and thoroughly tested. The integrations for Gemini CLI, Codex CLI, and Cursor are newer, so you may occasionally encounter limitations or need to make minor adjustments to fit your workflow.

If you’re using SAW with Claude Code for software development, you’re following the most established and well-tested path. If you’re using it for other domains or with newer integrations, be prepared to experiment and refine your setup as needed.

If this guide helped you set up a structured multi-agent workflow without building one from scratch, share it with your teammates or team lead so they can benefit from it too.
If you’re interested in building repeatable AI-powered workflows on Linux, check out our AI for Linux course, where you’ll learn how to create practical automations using tools like SAW and other AI-assisted development workflows.
Conclusion

You’ve successfully set up SAW by cloning the repository, copying the required files into your project, replacing the default placeholders with your own project details, and running your first ticket through the workflow.

Along the way, you also saw how SAW’s stop-the-line check ensures that work doesn’t begin until a ticket has clear acceptance criteria, and how the QAS approval step helps verify changes before they move forward.

The real strength of SAW isn’t just using multiple AI agents, it’s giving each agent a well-defined role and requiring work to pass through structured review stages.

This helps keep development consistent, reduces unnecessary changes, and makes it easier to track the progress of every task.

To see where your current work stands, run:

 /check-workflow

This command displays the current status of the workflow and shows which stage your ticket is in.

If this article helped, with someone on your team.


Saturday, March 14, 2026

MultiTail – What It Is and How It Can Make You a Better SysAdmin

https://idolinux.com/multitail-what-it-is-and-how-it-can-make-you-a-better-sysadmin

MultiTail – What It Is and How It Can Make You a Better SysAdmin

As a Linux administrator, you already know how important it is to master tools like iptables reject vs drop, netcat, df, du, kernel 6.19.3, the LS command, and vim. These are fundamentals. But once your infrastructure grows beyond a single service and a couple of log files, the classic tail -f workflow starts to feel painfully limited.

This is where MultiTail becomes a game changer.

In this in-depth guide, we’ll explore what MultiTail is, how it works, why it’s superior to traditional approaches, and how mastering it can seriously improve your effectiveness as a sysadmin.


What Is MultiTail?

MultiTail is a powerful terminal-based utility that allows you to view multiple log files simultaneously in a single terminal window. Think of it as tail -f on steroids.

Instead of opening several terminal tabs or splitting your screen with tmux, MultiTail creates dynamically managed panes inside one terminal session. Each pane can follow a different file, command output, or even network stream.

At its core, MultiTail is designed to:

  • Monitor multiple log files at once
  • Display them in split windows
  • Apply colorization rules
  • Merge multiple files into one unified view
  • Filter content live
  • Follow new files dynamically

If you manage web servers, databases, firewalls, containers, or microservices, this is not just convenient — it’s transformative.


Why tail -f Is No Longer Enough

Before diving into MultiTail, let’s be honest about traditional workflows.

Most admins start with:

tail -f /var/log/syslog

Then maybe:

tail -f /var/log/nginx/access.log

Then another terminal for:

tail -f /var/log/nginx/error.log

Soon you’re juggling:

  • Multiple SSH sessions
  • Split panes in tmux
  • Scroll chaos
  • Missed correlations between logs

Correlating events across multiple files in real time becomes difficult. When debugging production issues, seconds matter.

MultiTail solves this problem elegantly.


Installing MultiTail

On Debian/Ubuntu systems:

sudo apt update
sudo apt install multitail

On RHEL/CentOS (if available via EPEL):

sudo yum install multitail

To verify installation:

multitail --version

That’s it. No complex configuration required to get started.


Basic Usage: Viewing Multiple Files

The simplest use case:

multitail /var/log/syslog /var/log/auth.log

The terminal splits automatically into sections. Each file gets its own pane.

You can move between panes using keyboard shortcuts (like pressing b to switch windows).

Already more powerful than multiple tail -f sessions.


Vertical and Horizontal Splits

MultiTail allows layout control.

For vertical split:

multitail -s 2 /var/log/syslog /var/log/auth.log

For horizontal layout control:

multitail -l "tail -f /var/log/syslog" -l "tail -f /var/log/auth.log"

The -l option lets you monitor command output instead of just files.

This means you’re not limited to logs — you can monitor any command in real time.


Monitoring Commands Instead of Files

You can follow dynamic command outputs like:

multitail -l "dmesg -w" -l "journalctl -f"

Or combine log files and commands:

multitail /var/log/syslog -l "netstat -tulpn"

This is incredibly useful when debugging:

  • Network activity
  • Firewall events
  • Kernel messages
  • Service logs

Imagine diagnosing connectivity issues while watching firewall drops and application logs side by side.


Merging Multiple Logs Into One View

Sometimes separate panes are not what you want. You want a chronological, merged stream.

MultiTail can combine logs:

multitail -M /var/log/syslog /var/log/auth.log

This merges both files into a single window, ordered by timestamp.

This is extremely useful when correlating authentication failures with system events.


Automatic Detection of New Files

One powerful feature often overlooked: MultiTail can track files that appear dynamically.

Example scenario:

Your application generates logs like:

app-2026-03-01.log
app-2026-03-02.log

Instead of restarting your monitoring session daily, you can use wildcards:

multitail /var/log/app-*.log

It will follow newly created matching files automatically.

This is particularly useful in environments where logs rotate frequently.


Color Highlighting and Filtering

MultiTail supports automatic colorization and filtering.

You can filter a specific word:

multitail -e "ERROR" /var/log/syslog

Or display separate filtered views:

multitail -l "grep ERROR /var/log/syslog" -l "grep WARNING /var/log/syslog"

With color rules enabled, errors can appear red, warnings yellow, and info messages green.

This dramatically improves visual parsing speed during incident response.


Recursive Monitoring of Directories

If you need to monitor many logs recursively:

multitail -R 3 /var/log/

This searches log files recursively up to a specified depth.

For large infrastructures with complex logging trees, this feature saves enormous time.


Using MultiTail with systemd journalctl

Modern Linux systems use systemd, and logs often live in the journal.

You can combine MultiTail with journalctl:

multitail -l "journalctl -f -u nginx" -l "journalctl -f -u mysql"

Now you monitor multiple systemd services in parallel.

This avoids multiple terminal tabs and gives you synchronized visibility.


Navigating Inside MultiTail

MultiTail isn’t just a viewer — it’s interactive.

Common controls:

  • b – switch to next window
  • q – quit
  • Ctrl + c – stop command in active pane
  • Scroll up support (depending on configuration)
  • Resize windows dynamically

You’re no longer blind to previous output; you can inspect context more effectively than with plain tail -f.


Advanced Example: Real Incident Debugging

Let’s imagine a real production issue:

Users report slow logins.

You open:

multitail \
/var/log/nginx/access.log \
/var/log/nginx/error.log \
/var/log/auth.log \
-l "journalctl -f -u php-fpm"

In one terminal window you see:

  • Incoming requests
  • Backend errors
  • Authentication failures
  • PHP processing logs

Instead of context switching between terminals, everything appears in one place. Correlation becomes almost effortless.

This is where you transition from reactive administrator to proactive operator.


How MultiTail Makes You a Better SysAdmin

Mastering MultiTail improves you in multiple ways:

1. Faster Diagnosis

Less tab switching means faster thinking.
Faster thinking means faster resolution.

2. Better Event Correlation

Seeing logs side-by-side exposes patterns you would otherwise miss.

3. Reduced Cognitive Load

Instead of managing terminal sessions, you focus on the problem.

4. Improved Incident Handling

During outages, structure matters. MultiTail gives you structured visibility.

5. Stronger Command-Line Fluency

MultiTail encourages combining tools like:

  • grep
  • awk
  • journalctl
  • netstat
  • dmesg

This deepens your Linux proficiency overall.


MultiTail vs Alternatives

You could use:

  • tmux splits with multiple tail -f
  • watch command
  • less +F
  • GUI log aggregators

But MultiTail provides:

  • Native multi-pane layout
  • Built-in merging
  • Automatic file detection
  • Color coding
  • Interactive controls
  • Lightweight execution

No heavy centralized logging stack required.


Final Thoughts

If tools like df, du, vim, and the LS command are part of your daily routine, MultiTail deserves a place next to them.

It’s lightweight, powerful, and extremely practical.

You won’t notice how much time you’re wasting with traditional tail -f workflows — until you start using MultiTail.

After that, going back feels primitive.

In modern Linux environments where logs multiply rapidly and services interact constantly, MultiTail gives you clarity, speed, and confidence.

And those are exactly the qualities that separate average administrators from excellent ones.


Monday, July 14, 2025

How to Run a Python Script Using Docker

https://www.maketecheasier.com/run-python-script-using-docker

How to Run a Python Script Using Docker

Run Python Script Docker

Running Python scripts is one of the most common tasks in automation. However, managing dependencies across different systems can be challenging. That’s where Docker comes in. Docker lets you package your Python script along with all its required dependencies into a container, ensuring it runs the same way on any machine. In this step-by-step guide, we’ll walk through the process of creating a real-life Python script and running it inside a Docker container.

Why Use Docker for Python Scripts

When you’re working with Python scripts, things can get messy/complex very fast. Different projects need different libraries, and what runs on your machine might break on someone else’s. Docker solves that by packaging your script and its environment together. So instead of saying “It works on my machine”, you can be sure it works the same everywhere.

It also keeps your system clean. You don’t have to install every Python package globally or worry about version conflicts. Everything stays inside the container.

If you’re deploying or handing your script off to someone else, Docker makes that easy, too. No setup instructions, no “install this and that”. Just one command, and it runs.

Write the Python Script

Let’s create a project directory to keep your Python script and Dockerfile. Once created, navigate into this directory using the cd command:

mkdir docker_file_organizer
cd docker_file_organizer

Create a script named “organize_files.py” to scan a directory and group files into folders based on their file extensions:

nano organize_files.py

Paste the following code into the “organize_file.py” file. Here, we use two pre-built Python modules, named os and shutil, to handle files and create directories dynamically:

import os
import shutil

SOURCE_DIR = "/files"

def organize_by_extension(directory):
try:
for fname in os.listdir(directory):
path = os.path.join(directory, fname)
if os.path.isfile(path):
ext = fname.split('.')[-1].lower() if '.' in fname else 'no_extension'
dest_dir = os.path.join(directory, ext)
os.makedirs(dest_dir, exist_ok=True)
shutil.move(path, os.path.join(dest_dir, fname))
print(f"Moved: {fname} → {ext}/")
except Exception as e:
print(f"Error organizing files: {e}")

if __name__ == "__main__":
organize_by_extension(SOURCE_DIR)

In this script, we organize files in a given directory based on their extensions. We use the os module to list the files, check if each item is a file, extract its extension, and create folders named after those extensions (if they don’t already exist). Then, we use the shutil module to move each file into its corresponding folder. For each move, we print a message showing the file’s new location.

Create the Dockerfile

Now, create a Dockerfile to define the environment in which your script will run:

FROM python:latest
LABEL maintainer="you@example.com"
WORKDIR /usr/src/app
COPY organize_files.py .
CMD ["python", "./organize_files.py"]

We use this Dockerfile to create a container with Python, add our script to it, and make sure the script runs automatically when the container starts:

Create Docker File

Build the Docker Image

Before you can build the Docker image, you need to install Docker first. After that, run the following command to package everything into a Docker image:

sudo docker build -t file-organizer .

It reads our Dockerfile and puts together the Python setup and our script so they’re ready to run in a single container image:

Build Docker Image

Create a Sample Folder with Files

To see our script in action, we create a test folder named “sample_files” with a few files of different types. We created these files just to make the folder a bit messy and see how our Python script handles it:

mkdir ~/sample_files
touch ~/sample_files/test.txt
touch ~/sample_files/image.jpg
touch ~/sample_files/data.csv

Run the Script Inside Docker

Finally, we run our Docker container and mount the sample folder into it. The -v flag mounts your local “~/sample_files” directory to the “/files” directory in the container, which allows the Python script to read and organize files on your host machine:

docker run --rm -v ~/sample_files:/files file-organizer

Here, we use the --rm option to remove the container automatically after it finishes running, which saves disk space:

Run Script In Docker

In the end, we use the tree command to check if the files have been sorted into folders based on their extensions:

tree sample_files
Verify Result With Tree Command

Note: The tree command isn’t pre-installed on most systems. You can easily install it using a package manager like apt on Ubuntu, brew on macOS, and so on.

Final Thoughts

With your Python script running inside Docker, you’re all set to take full advantage of a clean, portable, and consistent development setup. You can easily reuse this containerized workflow for other automation tasks, share your script without worrying about dependencies, and keep your system clutter-free. As a next step, consider exploring how to build multi-script Docker images, schedule containers with cron jobs, or integrate your scripts with other tools like Git, Jenkins, or even cloud platforms to streamline your automation and deployment process. 

Saturday, May 24, 2025

LogKeys: Monitor Keyboard Keystrokes in Linux

https://www.tecmint.com/logkeys-monitor-keyboard-keystroke-linux

LogKeys: Monitor Keyboard Keystrokes in Linux

Keylogging, short for “keystroke logging” is the process of recording the keys struck on a keyboard, usually without the user’s knowledge.

Keyloggers can be implemented via hardware or software:

  • Hardware keyloggers intercept data at the physical level (e.g., between the keyboard and computer).
  • Software keyloggers, like LogKeys, capture keystrokes through the operating system.

This article explains how to use a popular open-source Linux keylogger called LogKeys for educational or testing purposes only. Unauthorized use of keyloggers to monitor someone else’s activity is unethical and illegal.

What is LogKeys?

LogKeys is an open-source keylogger for Linux that captures and logs keyboard input, including characters, function keys, and special keys. It is designed to work reliably across a wide range of Linux systems without crashing the X server.

LogKeys also correctly handles modifier keys like Alt and Shift, and is compatible with both USB and serial keyboards.

While there are numerous keylogger tools available for Windows, Linux has fewer well-supported options. Although LogKeys has not been actively maintained since 2019, it remains one of the more stable and functional keyloggers available for Linux as of today.

Installation of Logkeys in Linux

If you’ve previously installed Linux packages from a tarball (source), you should find installing the LogKeys package straightforward.

However, if you’ve never built a package from source before, you’ll need to install some required development tools first, such as C++ compilers and GCC libraries, before proceeding.

Installing Prerequisites

Before building LogKeys from source, ensure your system has the required development tools and libraries installed:

On Debian/Ubuntu:

sudo apt update
sudo apt install build-essential autotools-dev autoconf kbd

On Fedora/CentOS/RHEL:

sudo dnf install automake make gcc-c++ kbd

On openSUSE:

sudo zypper install automake gcc-c++ kbd

On Arch Linux:

sudo pacman -S base-devel kbd

Installing LogKeys from Source

First, download the latest LogKeys source package using the wget command, then, extract the ZIP archive and navigate into the extracted directory:

wget https://github.com/kernc/logkeys/archive/master.zip
unzip master.zip  
cd logkeys-master/

or clone the repository using Git, as shown below:

git clone https://github.com/kernc/logkeys.git
cd logkeys

Next, run the following commands to build and install LogKeys:

./autogen.sh         # Generate build configuration scripts
cd build                  # Switch to build directory
../configure              # Configure the build
make                      # Compile the source code
sudo make install         # Install binaries and man pages

If you encounter issues related to keyboard layout or character encoding, regenerate your locale settings:

sudo locale-gen

Usage of LogKeys in Linux

Once LogKeys is installed, you can begin using it to monitor and log keyboard input using the following commands.

Start Keylogging

This command starts the keylogging process, which must be run with superuser (root) privileges because it needs access to low-level input devices. Once started, LogKeys begins recording all keystrokes and saves them to the default log file: /var/log/logkeys.log.

Note: You won’t see any output in the terminal; logging runs silently in the background.

sudo logkeys --start

Stop Keylogging

This command terminates the keylogging process that was started earlier, which is important to stop LogKeys when you’re done, both to conserve system resources and to ensure the log file is safely closed.

sudo logkeys --kill

Get Help / View Available Options

The follwing command will displays all available command-line options and flags you can use with LogKeys.

logkeys --help

Useful options include:

  • --start : Start the logger
  • --kill : Stop the logger
  • --output <file> : Specify a custom log output file
  • --no-func-keys : Don’t log function keys (F1-F12)
  • --no-control-keys : Skip control characters (e.g., Ctrl+C, Backspace)

View the Logged Keystrokes

The cat command displays the contents of the default log file where LogKeys saves keystrokes.

sudo cat /var/log/logkeys.log

You can also open it with a text editor like nano or less:

sudo nano /var/log/logkeys.log
or
sudo less /var/log/logkeys.log

Uninstall LogKeys in Linux

To remove LogKeys from your system and clean up the installed binaries, manuals, and scripts, use the following commands:

cd build
sudo make uninstall

This will remove all files that were installed with make install, including the logkeys binary and man pages.

Conclusion

LogKeys is a powerful keylogger for Linux that enables users to monitor keystrokes in a variety of environments. Its compatibility with modern systems and ease of installation make it a valuable tool for security auditing, parental control testing, and educational research.

However, it’s crucial to emphasize that keylogging should only be used in ethical, lawful contexts—such as with explicit user consent or for personal system monitoring. Misuse can lead to serious legal consequences. Use responsibly and stay informed.


Sunday, May 11, 2025

How to Use Systemd to Run Bash Scripts at Boot in Linux

https://www.tecmint.com/create-new-service-units-in-systemd

How to Use Systemd to Run Bash Scripts at Boot in Linux

A few days ago, I came across a CentOS 8 32-bit distro and decided to test it on an old 32-bit machine. After booting up, I realized there was a bug causing the network connection to drop. Every time I rebooted, I had to manually bring the network back up, which led me to wonder: How can I automate this process with a script that runs every time the system boots?

The solution is straightforward, and today, I’ll show you how to do this using systemd service units, but before we jump into that, let’s first take a quick look at what a service unit is and how it works.

In this article, we’ll cover the basics of systemd service units, their relationship with “targets,” and how to set up a service unit to run a script at boot. I’ll keep things simple, focusing on the practical steps, so you’ll have everything you need to know to tackle this on your own.

What is a Systemd Service Unit?

In simple terms, a service unit in systemd is a configuration file that defines how a service should behave on your system. It could be something like a network service, a program, or even a script that needs to run when your computer boots or at a specific point during the boot process.

These service units are grouped into targets, which can be seen as milestones or stages in the boot process. For example, when your system reaches the multi-user target (runlevel 3), certain services will be started. You can think of these targets as “collections” of services that work together at various stages of the boot sequence.

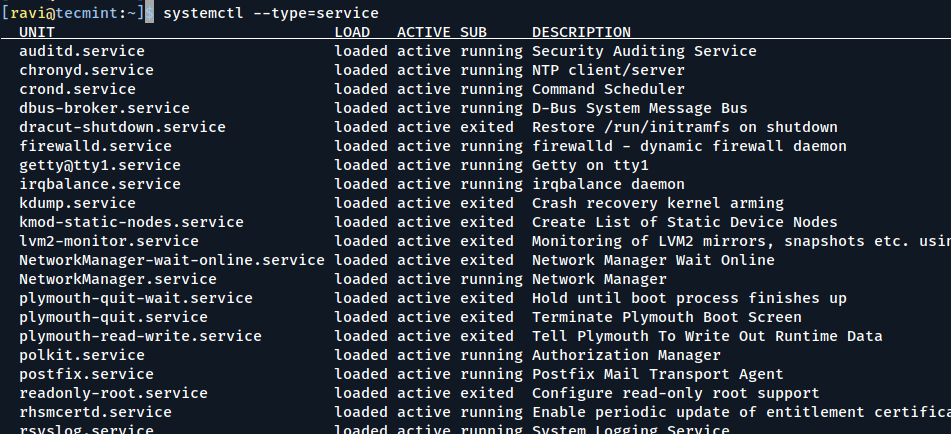
If you’d like to see the services running in a particular target (for example, graphical.target), you can use the systemctl command:

systemctl --type=service

This will show you all active services in your current target. Some services run continuously, while others start up once and then exit.

List All Active Services

Checking the Status of a Service

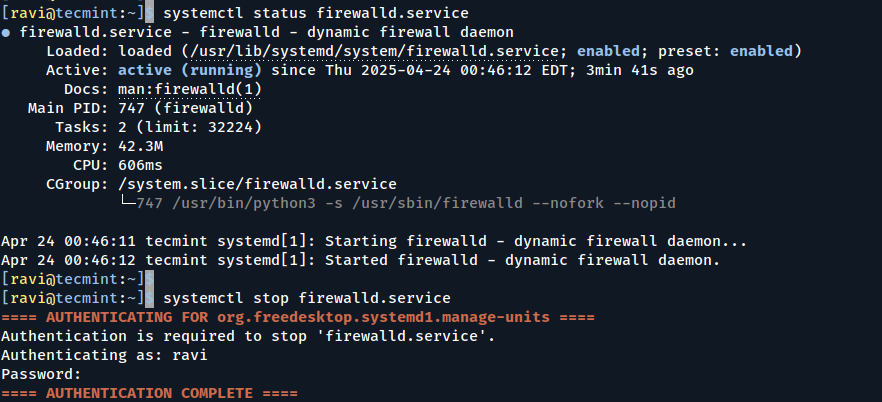
If you’re curious about a particular service, you can use systemctl status to see whether it’s active or inactive:

systemctl status firewalld.service

This command checks the status of the firewalld service. You’ll notice that it’s active, meaning it’s running, and enabled, which means it will start automatically on the next boot.

You can also stop a service temporarily (until the next boot) using:

systemctl stop firewalld.service
systemctl status firewalld.service

This will stop the firewalld service for this session, but won’t prevent it from starting up next time.

Check Status of Service

Enabling and Disabling Services

To ensure a service starts automatically on boot, you need to enable it, which will create a symbolic link in the appropriate target’s wants folder:

systemctl enable firewalld.service

To disable it, you would simply run:

systemctl disable firewalld.service
Enabling and Disabling Systemd Services

Creating a Custom Service Unit

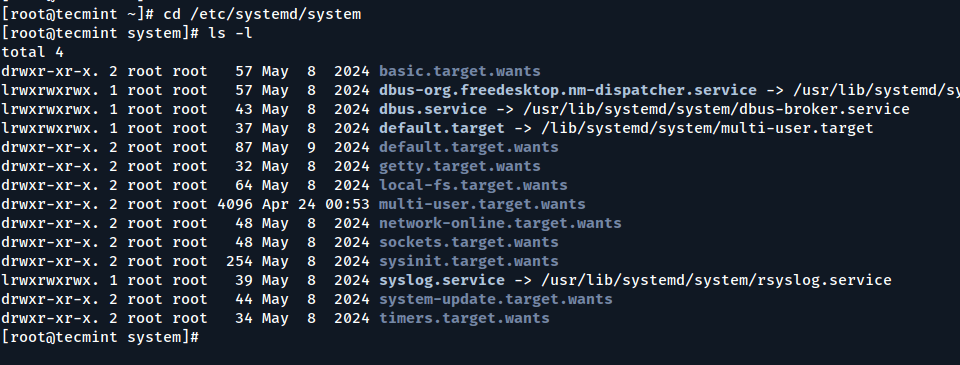
To set up a service that runs a script at boot, we’ll create a new service unit under the /etc/systemd/system directory, here you’ll see existing service unit files and folders for different targets.

cd /etc/systemd/system
ls -l
Existing Service Unit Files

Let’s create our own service unit called connection.service using Vim or your preferred text editor to create it:

vim connection.service
Or
vi connection.service

Add the following content to the file.

[Unit]
Description=Bring up network connection
After=network.target

[Service]
ExecStart=/root/scripts/conup.sh

[Install]
WantedBy=multi-user.target

Explanation:

  • [Unit]: The unit’s metadata. We’ve given it a description and told it to run after network.target, meaning it will only execute after the network has been initialized.
  • [Service]: This section defines the command to execute when the service starts. In this case, it runs the script conup.sh.
  • [Install]: This section tells systemd that the service should be loaded at the multi-user target, which is the standard runlevel for most systems.

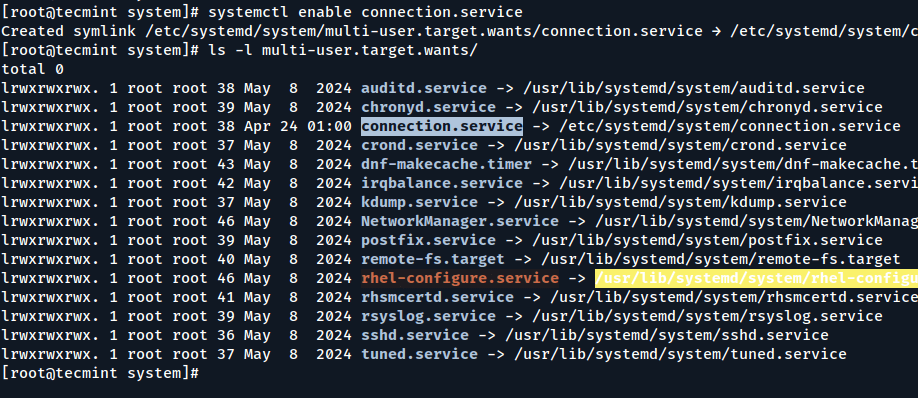
Now, enable the service so it will start automatically on the next boot:

systemctl enable connection.service

You can confirm that it has been enabled by checking the multi-user.target.wants directory:

ls -l multi-user.target.wants/

The symbolic link to connection.service should now be present. However, we still need to create the script that this service will run.

Verify Service Unit File

Creating the Script

Let’s now create the conup.sh script that will bring the network connection up.

cd /root
mkdir scripts
cd scripts
vi conup.sh

Add the following line to bring the network up, here the script uses the nmcli command to bring the network connection on the enp0s3 interface up.

#!/bin/bash
nmcli connection up enp0s3

Don’t forget to make the script executable.

chmod +x conup.sh

At this point, the service is ready to go.

SELinux Contexts (For RHEL/CentOS Users)

If you’re using a RHEL-based system (like CentOS or Rocky Linux), don’t forget about SELinux, which can block scripts from running if the correct security context isn’t applied.

To temporarily set the context so the system treats the script as a regular executable, use:

chcon -t bin_t /root/scripts/conup.sh

However, this change won’t survive a reboot or file relabeling.

To make it permanent, use:

semanage fcontext -a -t bin_t "/root/scripts/conup.sh"
restorecon -v /root/scripts/conup.sh

This step ensures the script continues to run properly even after reboots or SELinux policy reloads.

Testing the Service

To test it without rebooting, you can start it manually.

systemctl start connection.service

If everything is set up correctly, the service will execute the script, and your network connection should be restored.

Alternatively, if you wrote a simpler script like touch /tmp/testbootfile, you can check if the file was created in /tmp to confirm the service is running as expected.

Conclusion

By now, you should have a good understanding of systemd service units and how to create and manage them on your system. You’ve also automated a common task – bringing up the network connection on boot using a simple service unit.

Hopefully, this guide helps you get more comfortable with managing services, targets, and scripts in systemd, making your system more automated and efficient.


15 Useful ‘dpkg’ Commands for Debian and Ubuntu Users [With Examples]

https://www.tecmint.com/dpkg-command-examples

15 Useful ‘dpkg’ Commands for Debian and Ubuntu Users [With Examples]

Debian GNU/Linux is the backbone of several popular Linux distributions like Knoppix, Kali, Ubuntu, Mint, and more. One of its strongest features is its robust package management system, which makes installing, removing, and managing software a breeze.

Debian and its derivatives use a variety of package managers such as dpkg, apt, apt-get, aptitude, synaptic, tasksel, dselect, dpkg-deb, and dpkg-split. each serving a different purpose.

Let’s quickly go over the most common ones before diving deeper into the dpkg command.

Common Debian-Based Package Managers

Command Description
apt apt, short for Advanced Package Tool, is used in Debian-based systems to install, remove, and update software packages.
aptitude aptitude is a text-based front-end to apt, great for those who prefer a terminal-based interface with menus.
synaptic synaptic is a graphical package manager that makes it easy to install, upgrade, and uninstall packages even for novices.
tasksel tasksel allows users to install all packages related to a specific task (like a desktop environment or a LAMP server).
dselect dselect is a menu-driven package management tool initially used during the first install, and is now replaced with aptitude.
dpkg-deb Used for working directly with .deb archives – creating, extracting, and inspecting them.
dpkg-split dpkg-split is useful for splitting and merging large files into chunks of smaller files to be stored on media of smaller sizes, such as floppy disks.

dpkg is the main package management program in Debian and Debian-based systems, used to install, build, remove, and manage packages. aptitude is the primary front-end to dpkg.

Some of the most commonly used dpkg commands, along with their usages, are listed here:

1. Install a Package on Ubuntu

To install a package using dpkg, you need to download .deb package file from the following official package repository sites for Debian and Ubuntu-based distributions.

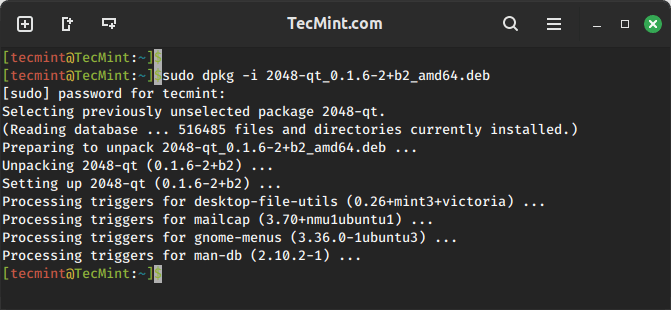
Once downloaded, you can install it using the -i option followed by the name of the .deb package file.

sudo dpkg -i 2048-qt_0.1.6-2+b2_amd64.deb
Install Deb Package
Install the Deb Package

2. List Installed Packages on Ubuntu

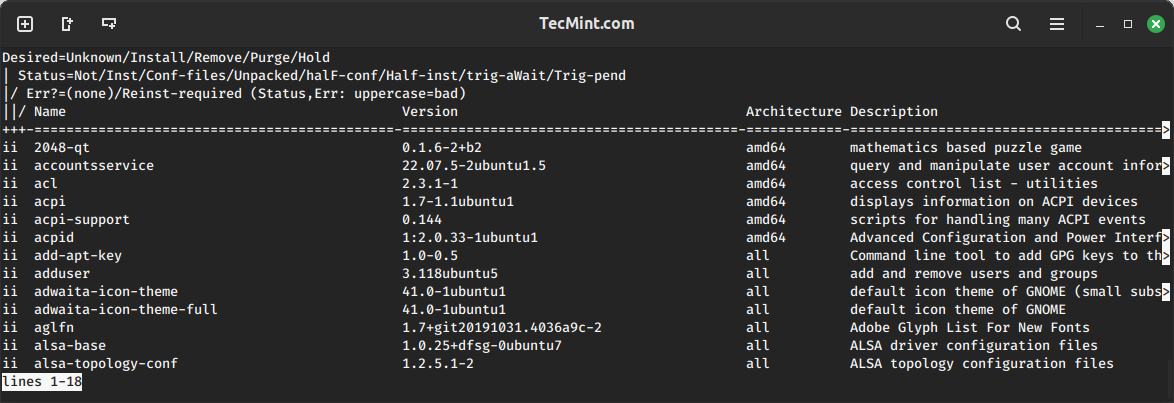
To view and list all the installed packages, use the “-l” option along with the command.

dpkg -l
List Installed Deb Packages
List Installed Debian Packages

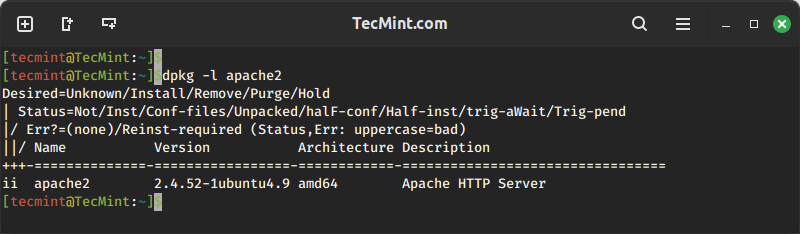
To view a specific package installed or not, use the option “-l” along with the package name. For example, check whether the apache2 package is installed or not.

dpkg -l apache2
Check Package Installation

3. Remove a Package on Ubuntu

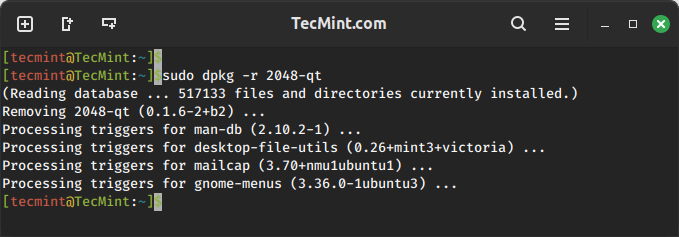
To remove the “.deb” package, we must specify the package name “2048-qt” with the “-r” option, which is used to remove/uninstall a package.

sudo dpkg -r 2048-qt
Remove Deb Package
Remove Deb Package

You can also use ‘p‘ option in place of ‘r' which will remove the package along with the configuration file. The ‘r‘ option will only remove the package and not the configuration files.

[root@tecmint~]# dpkg -p flashpluginnonfree

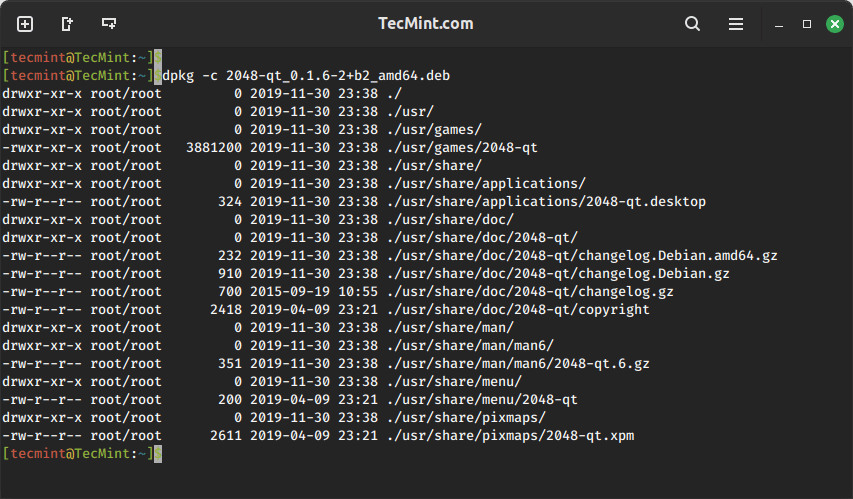
4. View Contents of a .deb Package

To view the content of a particular .deb package, use the “-c” option, which will display the contents of a deb package in long-list format.

dpkg -c 2048-qt_0.1.6-2+b2_amd64.deb
View Contents of Deb Package

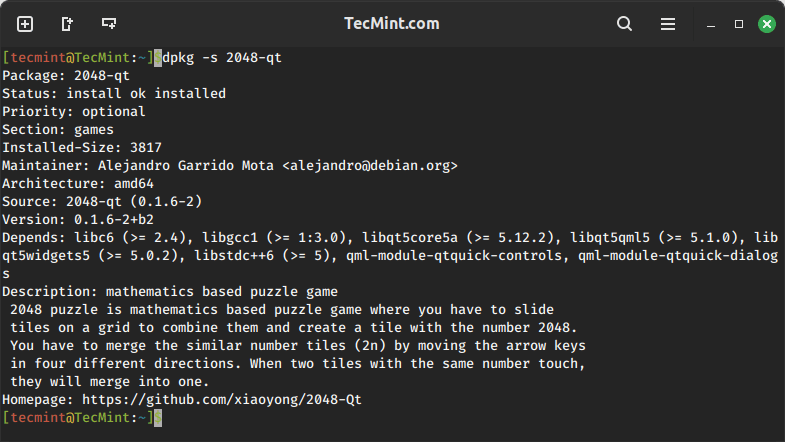
5. Check Status of Deb Package Installation

Using “-s” option with the package name will display whether a deb package is installed or not.

dpkg -s 2048-qt
Check Deb Package Installation

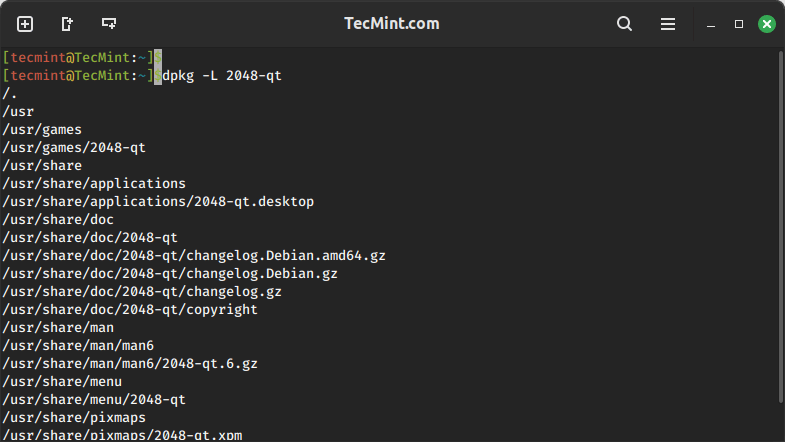
6. List Files Installed by Deb Package

To list the location of all the files installed by a particular package, use the -L option as shown.

dpkg -L 2048-qt
List Files Installed by Deb Package

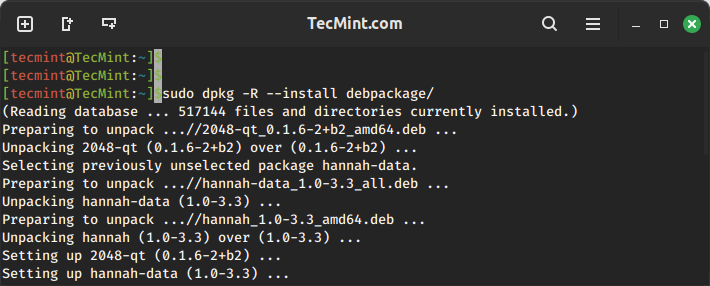
7. Install Multiple Debian Packages from a Directory

Recursively install all .deb files found in specified directories and all of their subdirectories, use the '-R' and '--install' options.

For example, to install all '.deb' packages from the directory named ‘debpackages‘.

sudo dpkg -R --install debpackages
Install All Deb Packages

8. Extract Contents of a Deb Package

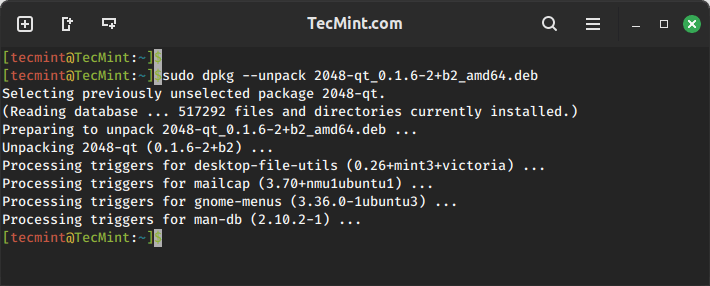
To extract the contents of a .deb package but does not configure the package, use the --unpack option.

sudo dpkg --unpack 2048-qt_0.1.6-2+b2_amd64.deb
Extract Contents of Deb Package

9. Reconfigure a Unpacked Deb Package

To configure a package that has been unpacked but not yet configured, use the “--configure” option as shown.

sudo dpkg --configure flashplugin-nonfree

10. Updating Package Information in System Database

The “–-update-avail” option replaces the old information with the available information for the package file in the package management system’s database.

sudo dpkg --update-avail package_name

11. Delete Information of Package

The action “--clear-avaial” will erase the current information about what packages are available.

sudo dpkg –-clear-avail

12. Forget Uninstalled and Unavailable Packages

The dpkg command with the option “–forget-old-unavail” will automatically forget uninstalled and unavailable packages.

sudo dpkg --forget-old-unavail

13. Display dpkg Licence

dpkg --licence

14. Display dpkg Version

The “--version” argument will display the dpkg version information.

dpkg –version

15. View dpkg Help

The “--help” option will display a list of available options of the dpkg command.

dpkg –help

That’s all for now. I’ll soon be here again with another interesting article. If I’ve missed any commands in the list, do let me know via comments.

Till then, stay tuned and keep connected to Tecmint. Like and share with us and help us spread. Don’t forget to mention your valuable thoughts in a comment.


Wednesday, May 7, 2025

5 Best Tools to Monitor and Debug Disk I/O Performance in Linux

https://www.tecmint.com/monitor-linux-disk-io-performance

5 Best Tools to Monitor and Debug Disk I/O Performance in Linux

Brief: In this guide, we will discuss the best tools for monitoring and debugging disk I/O activity (performance) on Linux servers.

A key performance metric to monitor on a Linux server is disk I/O (input/output) activity, which can significantly impact several aspects of a Linux server, particularly the speed of saving to or retrieving from disk, of files or data (especially on database servers). This has a ripple effect on the performance of applications and services.

1. iostat – Shows Device Input and Output Statistics

iosat is one of the many terminal-based system monitoring utilities in the sysstat package, which is a widely used utility designed for reporting CPU statistics and I/O statistics for block devices and partitions.

To use iostat on your Linux server, you need to install the sysstat package on your Linux system by running the applicable command for your Linux distribution.

sudo apt install sysstat          [On Debian, Ubuntu and Mint]
sudo yum install sysstat          [On RHEL/CentOS/Fedora and Rocky Linux/AlmaLinux]
sudo emerge -a app-admin/sysstat  [On Gentoo Linux]
sudo apk add sysstat              [On Alpine Linux]
sudo pacman -S sysstat            [On Arch Linux]
sudo zypper install sysstat       [On OpenSUSE]    

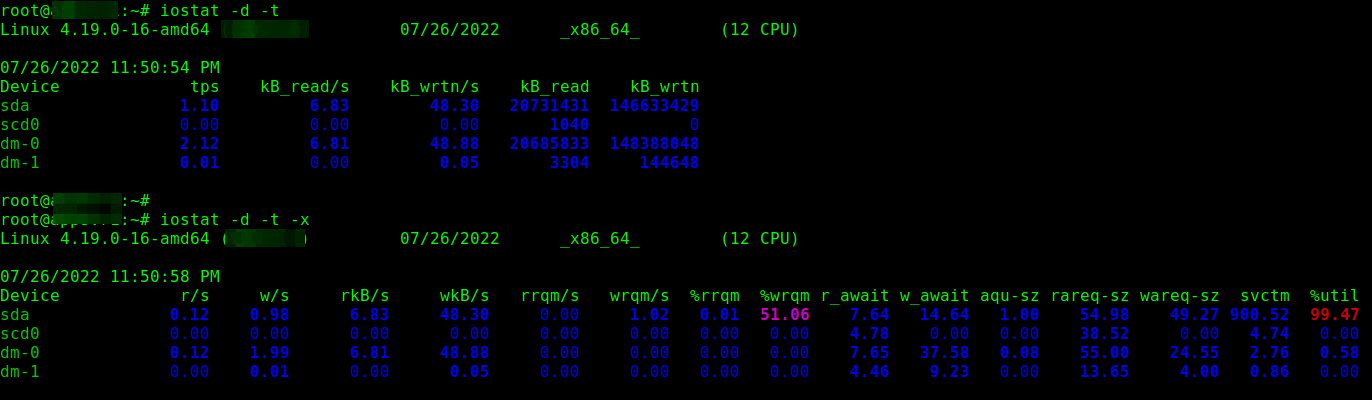
To show a simple device utilization report, run iostat with the -d command line option. Usually, the first report provides statistics about the time since the system startup (boot time), and each subsequent report is concerned with the time since the previous report.

Use the -x for an extended statistics report and the -t flag to enable time for each report. Besides, If you wish to eliminate devices without any activity in the report output, add the -z flag:

iostat -d -t 
OR
iostat -d -x -t 
iostat - Monitor Device Statistics in Linux
iostat – Monitor Device Statistics in Linux

To display statistics in kilobytes per second as opposed to blocks per second, add the -k flag, or use the -m flag to display stats in megabytes per second.

iostat -d -k
OR
iostat -d -m

iostat can also display continuous device reports at x second intervals. For example, the following command displays reports at two-second intervals:

iostat -d 2

Related to the previous command, you can display n number of reports at x second intervals. The following command will display 10 reports at two-second intervals.

iostat -d 2 10

Alternatively, you can save the report to a file for later analysis.

iostat -d 2 10 > disk_io_report.txt &

For more information about the report columns, read the iostat man page:

man iostat

2. sar – Show Linux System Activity

sar is another useful utility that ships with the sysstat package, intended to collect, report, or save system activity information. Before you can start using it, you need to set it up as follows.

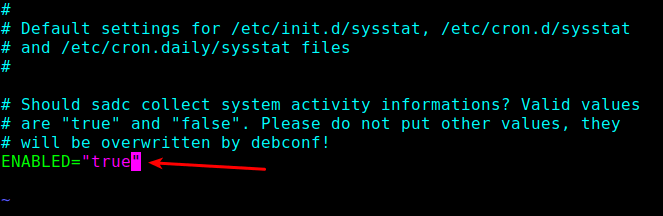
First, enable it to collect data in the /etc/default/sysstat file.

vi /etc/default/sysstat

Look for the following line and change the value to “true” as shown.

ENABLED="true"
Enable Sar in Linux
Enable Sar in Linux

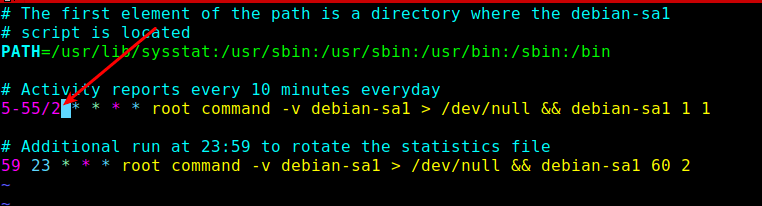
Next, you need to reduce the data collection interval defined in the sysstat cron jobs. By default, it is set to every 10 minutes, you can lower it to every 2 minutes.

You can do this in the /etc/cron.d/sysstat file:

# vi /etc/cron.d/sysstat
Configure Sar Cron in Linux

Save the file and close it.

Finally, enable and start the sysstat service using the following systemctl command:

systemctl enable --now sysstat.service
systemctl start sysstat.service

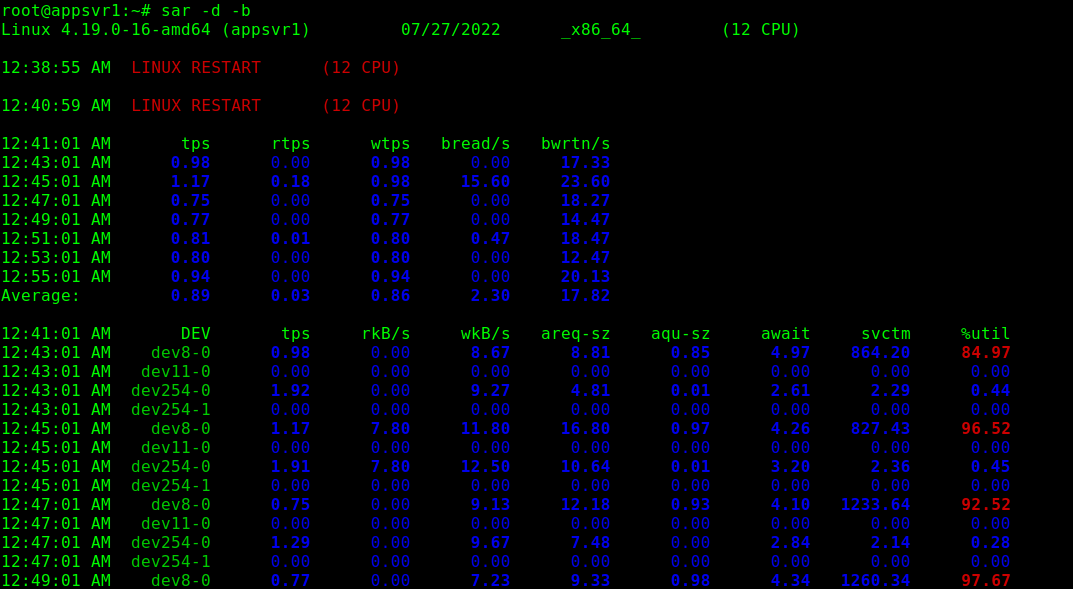
Next, wait for 2 minutes to start viewing sar reports. Use the sar command and the -b command line option to report I/O and transfer rate statistics and -d to report activity for each block device as shown.

sar -d -b
Sar - Monitor Linux System Activity
Sar – Monitor Linux System Activity

3. iotop – Monitor Linux Disk I/O Usage

Similar to the top monitoring tool in terms of design, iotop is a simple utility that enables you to monitor disk I/O activity and usage on a per-process basis.

You can get it installed on your Linux server as follows (remember to run the appropriate command for your Linux distribution):

sudo apt install iotop             [On Debian, Ubuntu and Mint]
sudo yum install iotop             [On RHEL/CentOS/Fedora and Rocky Linux/AlmaLinux]
sudo emerge -a sys-processs/iotop  [On Gentoo Linux]
sudo apk add iotop                 [On Alpine Linux]
sudo pacman -S iotop               [On Arch Linux]
sudo zypper install iotop          [On OpenSUSE]    

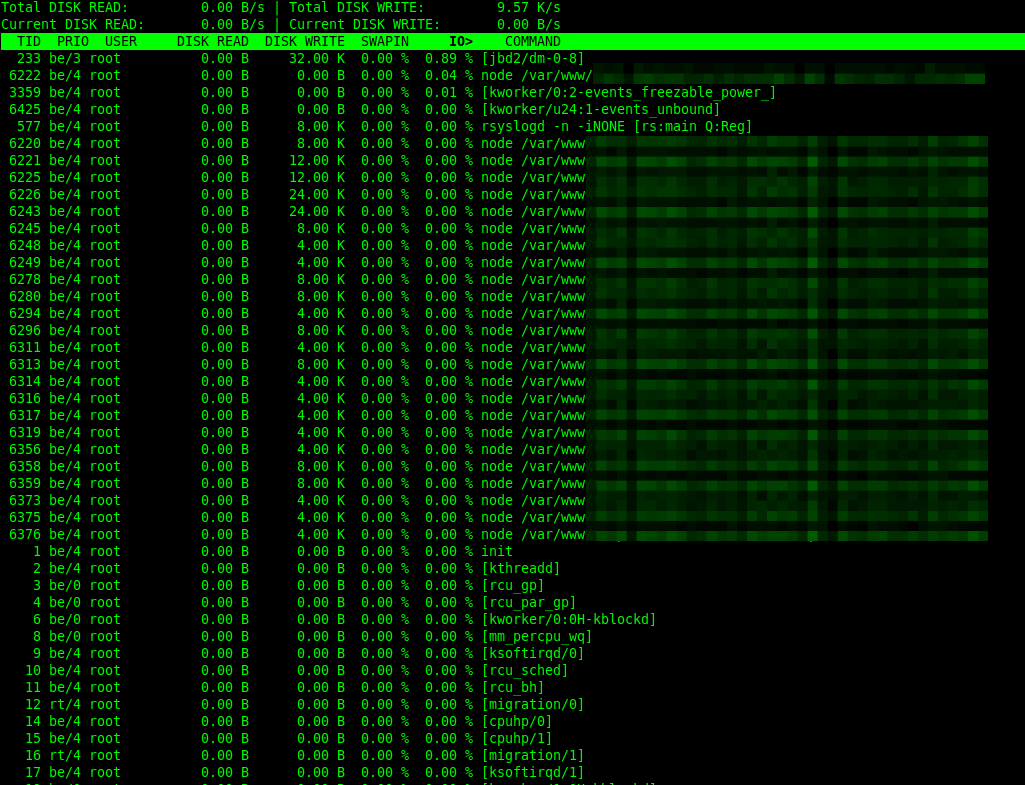
To monitor per-process I/O activity, you can run iotop without any arguments as follows. By default, the delay between iterations is 1 second. You can change this using the -d flag.

iotop
OR
iotop -d 2
iotop - Monitor Linux Disk Usage
iotop – Monitor Linux Disk Usage

iotop will by default display all threads of a process. To change this behavior so that it only shows processes, use the -P command line option.

iotop -P

Also, using the -a option, you can instruct it to display accumulated I/O as opposed to showing bandwidth. In this mode, iotop shows the amount of I/O processes performed since iotop was invoked.

iotop -P -a

4. dstat – Versatile Real-Time Resource Statistics

dstat is a powerful all-in-one replacement for older tools like vmstat, iostat, netstat, and others. It provides real-time stats for various system resources—including CPU, disk, memory, and network—in a clean, color-coded format.

To install dstat, use the relevant command for your Linux distro:

sudo apt install dstat             # On Debian, Ubuntu, and Mint
sudo yum install dstat             # On RHEL, CentOS, Fedora, Rocky Linux, AlmaLinux
sudo emerge -a sys-process/dstat   # On Gentoo Linux
sudo apk add dstat                 # On Alpine Linux
sudo pacman -S dstat               # On Arch Linux
sudo zypper install dstat          # On OpenSUSE

To run it with default settings (which includes CPU, disk, and network I/O):

dstat

If you want to focus only on disk activity, use:

dstat -d

You can also mix and match different options. For example, to monitor CPU, memory, and disk:

dstat -cdm

To log output to a CSV file for later analysis:

dstat -cdm --output system_stats.csv

dstat is super flexible and great for getting a quick, holistic view of your system in real time.

5. atop – Advanced System and Process Monitor

atop is like top, but on steroids, which gives you detailed, per-process resource usage, including disk I/O, memory, CPU, and network, making it great for in-depth analysis, especially when diagnosing performance issues over time.

Install it using your distro’s package manager:

sudo apt install atop             # On Debian, Ubuntu, and Mint
sudo yum install atop             # On RHEL, CentOS, Fedora, Rocky Linux, AlmaLinux
sudo emerge -a sys-process/atop   # On Gentoo Linux
sudo apk add atop                 # On Alpine Linux
sudo pacman -S atop               # On Arch Linux
sudo zypper install atop          # On OpenSUSE

To launch it:

atop

By default, it updates every 10 seconds. You can change the interval like this:

atop 2

One of its best features is that, it records data to a log file automatically (usually in /var/log/atop/).

atop -r /var/log/atop/atop_YYYYMMDD

It’s especially useful for tracing performance issues after they’ve already happened.

That’s all we had for you! We would like to know your thoughts about this guide or the above tools. Leave a comment via the feedback form below.

You can also inform us about tools that you think are missing in this list, but deserve to appear here.


How to Delete All Files in a Folder Except Certain Extensions

https://www.tecmint.com/delete-files-except-certain-file-extensions

How to Delete All Files in a Folder Except Certain Extensions

Sometimes, you may find yourself in a situation where you need to delete all files in a directory or simply clean up a directory by removing all files except those with a specific extension (e.g., files ending with a particular type).

In this article, we will show you how to delete files in a directory, excluding certain file extensions or types, using the rm, find, and globignore commands.

Before we move any further, let us start by briefly having a look at one important concept in Linux – filename pattern matching, which will enable us to deal with our issue at hand.

In Linux, a shell pattern is a string that consists of the following special characters, known as wildcards or metacharacters:

  • * – matches zero or more characters
  • ? – matches any single character
  • [seq] – matches any character in seq
  • [!seq] – matches any character not in seq

There are three possible methods we shall explore here, and these include:

Delete Files Using Extended Pattern Matching Operators

The extended pattern matching operators are listed below. In this case, pattern-list refers to one or more filenames, separated using the | character:

  • *(pattern-list) – matches zero or more occurrences of the specified patterns
  • ?(pattern-list) – matches zero or one occurrence of the specified patterns
  • +(pattern-list) – matches one or more occurrences of the specified patterns
  • @(pattern-list) – matches one of the specified patterns
  • !(pattern-list) – matches anything except one of the given patterns

To use them, enable the extglob shell option as follows:

shopt -s extglob

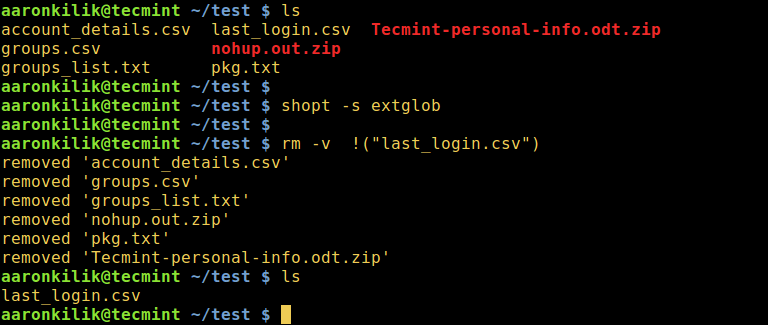
1. To delete all files in a directory except a specific file, type the following command:

rm -v !("filename")
Delete All Files Except One File in Linux

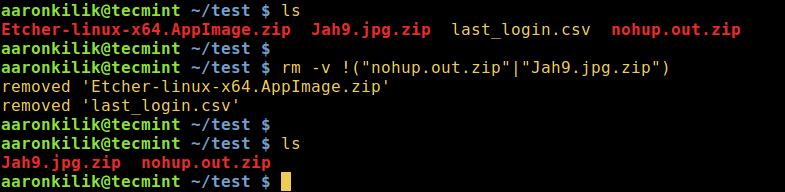
2. To delete all files with the exception of filename1 and filename2:

rm -v !("filename1"|"filename2") 
Delete All Files Except Few Files in Linux
Delete All Files Except a Few Files in Linux

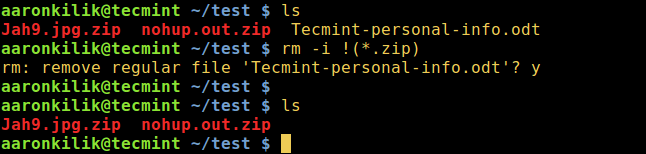
3. To remove all files except for .zip files, interactively:

rm -i !(*.zip)
Delete All Files Except Zip Files in Linux

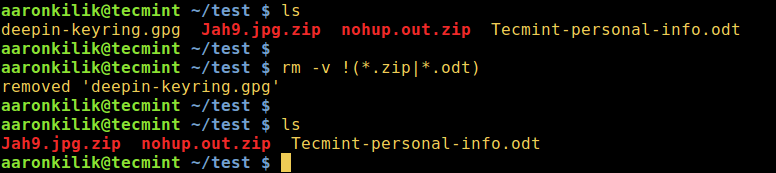
4. To delete all files except for .zip and .odt files while displaying the actions being performed:

rm -v !(*.zip|*.odt)
Delete All Files Except Certain File Extensions

Once you have all the required commands, turn off the extglob shell option like so:

shopt -u extglob

Delete Files Using Linux find Command

Under this method, we can use find command exclusively with appropriate options or in conjunction with the xargs command by employing a pipeline as in the forms below:

find /directory/ -type f -not -name 'PATTERN' -delete
find /directory/ -type f -not -name 'PATTERN' -print0 | xargs -0 -I {} rm {}
find /directory/ -type f -not -name 'PATTERN' -print0 | xargs -0 -I {} rm [options] {}

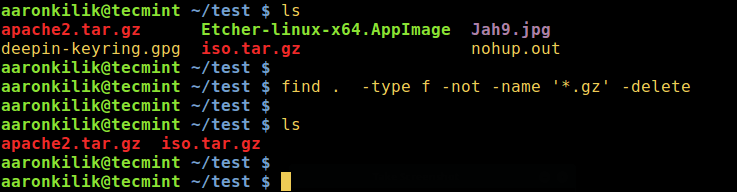
5. The following command will delete all files apart from .gz files in the current directory:

find . -type f -not -name '*.gz'-delete
Command find - Remove All Files Except .gz Files
Command find – Remove All Files Except .gz Files

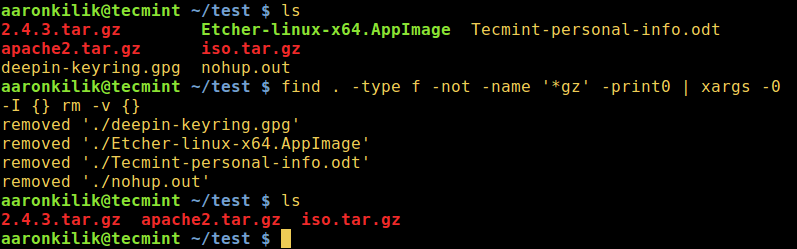
6. Using a pipeline and xargs, you can modify the case above as follows:

find . -type f -not -name '*gz' -print0 | xargs -0  -I {} rm -v {}
Remove Files Using find and xargs Commands

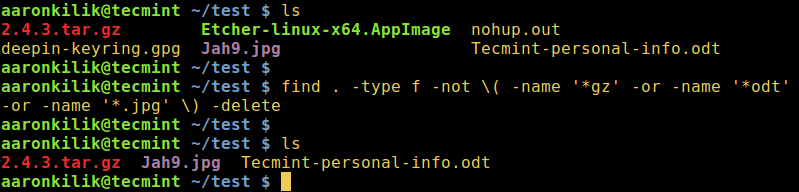
7. Let us look at one additional example, the command below will wipe out all files excluding .gz, .odt, and .jpg files in the current directory:

find . -type f -not \(-name '*gz' -or -name '*odt' -or -name '*.jpg' \) -delete
Remove All Files Except File Extensions

Delete Files Using Bash GLOBIGNORE Variable

This last approach, however, only works with bash. Here, the GLOBIGNORE variable stores a colon-separated pattern-list (filenames) to be ignored by pathname expansion.

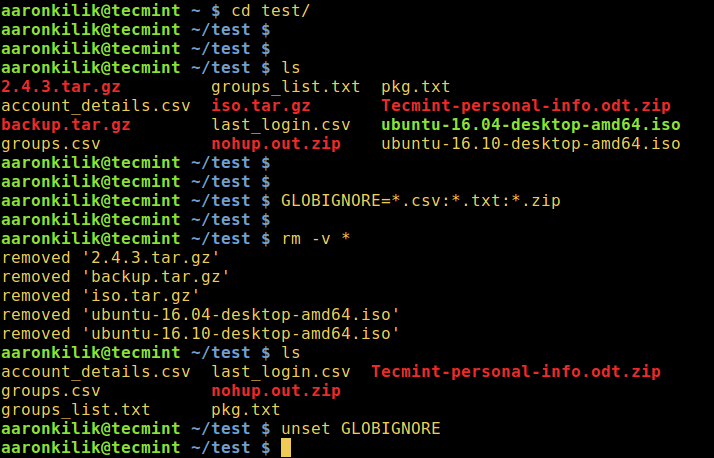
To employ this method, move into the directory that you wish to clean up, then set the GLOBIGNORE variable as follows:

cd test
GLOBIGNORE=*.odt:*.iso:*.txt

In this instance, all files other than .odt, .iso, and .txt files with be removed from the current directory.

Now run the command to clean up the directory:

rm -v *

Afterwards, turn off GLOBIGNORE variable:

$ unset GLOBIGNORE
Delete Files Using Bash GLOBIGNORE Variable

Note: To understand the meaning of the flags employed in the commands above, refer to the man pages of each command we have used in the various illustrations.

Conclusion

These are a few simple and effective ways to delete files in Linux, keeping only those with specific extensions or filenames intact. If you know of any other useful command-line techniques for cleaning up directories, feel free to share them in the feedback section below.