https://linuxiac.com/top-devops-tools

In recent years, DevOps has emerged as a critical discipline that merges software development (Dev) with IT operations (Ops). It aims to shorten the development lifecycle and provide continuous delivery with high software quality.
As the demand for faster development cycles and more reliable software increases, professionals in the field constantly seek tools and practices to enhance their efficiency and effectiveness.
Enter the realm of free and open-source tools – a goldmine for DevOps practitioners looking to stay ahead of the curve.
This article is designed for DevOps professionals, whether you’re just starting or looking to refine your craft. We’ve curated a list of ten essential free and open-source tools that have proven themselves and stand out for their effectiveness and ability to streamline the DevOps process.
These tools cover a range of needs, from continuous integration and delivery (CI/CD) to infrastructure as code (IaC), monitoring, and more, ensuring you have the resources to tackle various challenges head-on.
Additionally, these tools have become essential for every DevOps engineer to know and use. Getting the hang of them can boost your career in the field. So, based on our hands-on industry experience, we’ve compiled this list for you. But before we go further, let’s address a fundamental question.
What is DevOps?
DevOps is a set of practices and methodologies that brings together the development (those who create software) and operations (those who deploy and maintain software) teams.
Instead of working in separate silos, these teams collaborate closely throughout the entire software lifecycle, from design through the development process to production support.
But what exactly does it mean, and why is it so important? Let’s break it down in an easy-to-understand way.
Imagine you’re part of a team creating a puzzle. The developers are those who design and make the puzzle pieces, while the operations team is responsible for putting the puzzle together and making sure it looks right when completed.
In traditional settings, these teams might work separately, leading to miscommunication, delays, and a final product that doesn’t fit perfectly.
DevOps ensures everyone works together from the start, shares responsibilities, and communicates continuously to solve problems faster and more effectively. It’s the bridge that connects the creation and operation of software into a cohesive, efficient, and productive workflow.
In other words, DevOps is the practice that ensures both teams are working in tandem and using the same playbook. The end game is to improve software quality and reliability and speed up the time it takes to deliver software to the end users.
Key Components of DevOps
- Continuous Integration (CI): This practice involves developers frequently merging their code changes into a central repository, where automated builds and tests are run. The idea is to catch and fix integration errors quickly.
- Continuous Delivery (CD): Following CI, continuous delivery automates the delivery of applications to selected infrastructure environments. This ensures that the software can be deployed at any time with minimal manual intervention.
- Automation: Automation is at the heart of DevOps. It applies to testing, deployment, and even infrastructure provisioning, helping reduce manual work, minimize errors, and speed up processes.
- Monitoring and Feedback: Constant application and infrastructure performance monitoring is crucial. It helps quickly identify and address issues. Feedback loops allow for continuous improvement based on real user experiences.
DevOps Life Cycle
Grasping the various stages of the DevOps life cycle is key to fully comprehending the essence of the DevOps methodology. So, if you’re just entering this field, we’ve broken them down below to clarify things.
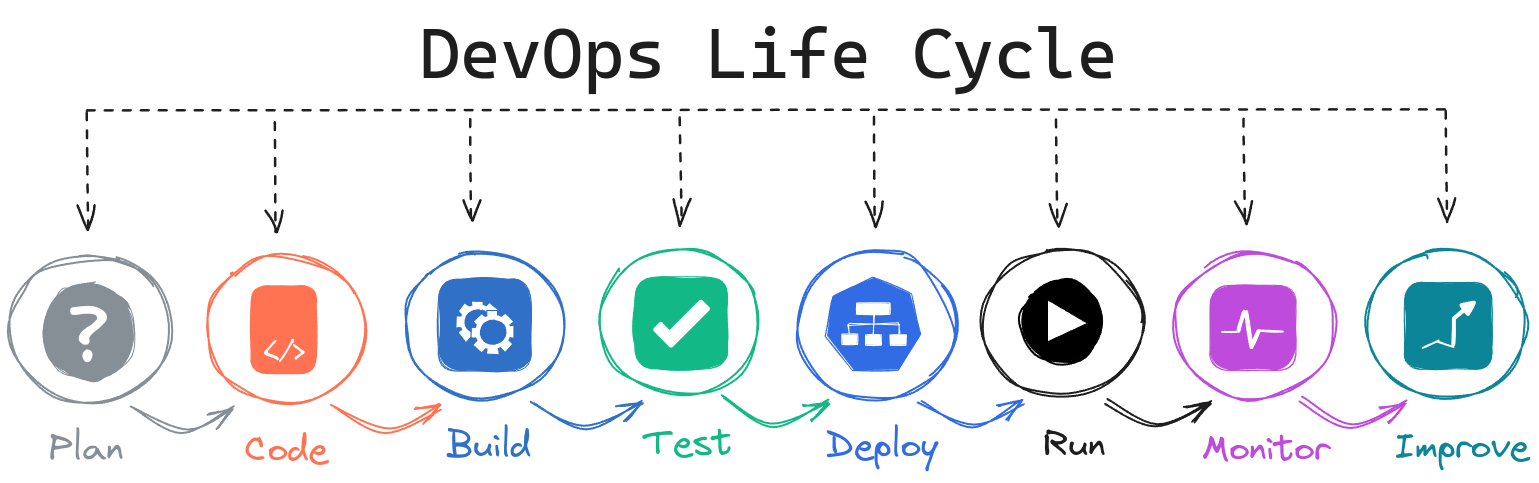
- Plan: In this initial stage, the team decides on the software’s features and capabilities. It’s like laying out a blueprint for what needs to be built.
- Code: Developers write code to create the software once the plan is in place. This phase involves turning ideas into tangible products using programming languages and tools.
- Build: After coding, the next step is to compile the code into a runnable application, which involves converting source code into an executable program.
- Test: Testing is crucial for ensuring the quality and reliability of the software. In this phase, automated tests are run to find and fix bugs or issues before the software is released to users.
- Deploy & Run: Once the software passes all tests, it’s time to release it and run it into the production environment where users can access it. Deployment should be automated for frequent and reliable releases with minimal human intervention.
- Monitor: Monitoring involves collecting, analyzing, and using data about the software’s performance and usage to identify issues, trends, or areas for improvement.
- Improve: The final stage closes the loop, where feedback from monitoring and end-user experiences is used to make informed decisions on future improvements or changes.
However, to make this happen, we need specific software tools. The good news is that the top ones in the DevOps ecosystem are open-source! Here they are.
Linux: The DevOps’ Backbone

We’ve left Linux out of the numbered list below of the key DevOps tools, not because it’s unimportant, but because calling it just a ‘tool’ doesn’t do it justice. Linux is the backbone of all DevOps activities, making everything possible.
In simple terms, DevOps as we know it wouldn’t exist without Linux. It’s like the stage where all the DevOps magic happens.
We’re highlighting this to underline how crucial it is to have Linux skills if you’re planning to dive into the DevOps world.
Understanding the basics of how the Linux operating system works is fundamental. Without this knowledge, achieving high expertise and success in DevOps can be quite challenging.
1. Docker

Docker and container technology have become foundational to the DevOps methodology. They have revolutionized how developers build, ship, and run applications, unprecedentedly bridging the gap between code and deployment.
Containers allow a developer to package an application with all of its needed parts, such as libraries and other dependencies, and ship it as one package. This consistency significantly reduces the “it works on my machine” syndrome, streamlining the development lifecycle and enhancing productivity.
At the same time, the Docker containers can be started and stopped in seconds, making it easier to manage peak loads. This flexibility is crucial in today’s agile development processes and continuous delivery cycles, allowing teams to push updates to production faster and more reliably.
Let’s not forget that containers also provide isolation between applications, ensuring that each application and its runtime environment can be secured separately. This helps minimize conflict between running applications and enhances security by limiting the surface area for potential attacks.
Even though containers were around before Docker arrived, it made them popular and set them up as a key standard widely used in the IT industry. These days, Docker remains the top choice for working with containers, making it an essential skill for all DevOps professionals.
2. Kubernetes

We’ve already discussed containers. Now, let’s discuss the main tool for managing them, known as the ‘orchestrator’ in the DevOps ecosystem.
While there are other widely used alternatives in the container world, such as Podman, LXC, etc., when we talk about container orchestration, one name stands out as the ultimate solution – Kubernetes.
As a powerful, open-source platform for automating the deployment, scaling, and management of containerized applications, Kubernetes has fundamentally changed how development and operations teams work together to deliver applications quickly and efficiently by automating the distribution of applications across a cluster of machines.
It also enables seamless application scaling in response to fluctuating demand, ensuring optimal resource utilization and performance. Abstracting the complexity of managing infrastructure, Kubernetes allows developers to focus on writing code and operations teams to concentrate on governance and automation.
Moreover, Kubernetes integrates well with CI/CD pipelines, automating the process from code check-in to deployment, enabling teams to release new features and fixes rapidly and reliably.
In simple terms, knowing how to use Kubernetes is essential for every professional in the DevOps field. If you’re in this industry, learning Kubernetes is a must.
3. Python

At the heart of DevOps is the need for automation. Python‘s straightforward syntax and extensive library ecosystem allow DevOps engineers to write scripts that automate deployments, manage configurations, and streamline the software development lifecycle.
Its wide adoption and support have led to the development of numerous modules and tools specifically designed to facilitate DevOps processes.
Whether it’s Ansible for configuration management, Docker for containerization, or Jenkins for continuous integration, Python serves as the glue that integrates these tools into a cohesive workflow, enabling seamless operations across different platforms and environments.
Moreover, it is pivotal in the IaC (Infrastructure as Code) paradigm, allowing teams to define and provision infrastructure through code. Libraries such as Terraform and CloudFormation are often used with Python scripts to automate the setup and management of servers, networks, and other cloud resources.
We can continue by saying that Python’s data analysis and visualization capabilities are invaluable for monitoring performance, analyzing logs, and identifying bottlenecks. Tools like Prometheus and Grafana, often integrated with Python, enable DevOps teams to maintain high availability and performance.
Even though many other programming languages, such as Golang, Java, Ruby, and more, are popular in the DevOps world, Python is still the top choice in the industry. This is supported by the fact that, according to GitHub, the biggest worldwide code repository, Python has been the most used language over the past year.
4. Git

Git, a distributed version control system, has become indispensable for DevOps professionals. First and foremost, it enables team collaboration by allowing multiple developers to work on the same project simultaneously without stepping on each other’s toes.
It provides a comprehensive history of project changes, making it easier to track progress, revert errors, and understand the evolution of a codebase. This capability is crucial for maintaining the speed and quality of development that DevOps aims for.
Moreover, Git integrates seamlessly with continuous integration/continuous deployment (CI/CD) pipelines, a core component of DevOps practices. Understanding Git also empowers DevOps professionals to implement and manage code branching strategies effectively, such as the popular Git flow.
A lot of what DevOps teams do begins with a simple Git command. It kicks off a series of steps in the CI/CD process, ultimately leading to a completed software product, a functioning service, or a settled IT infrastructure.
In conclusion, for industry professionals, commands like “pull,” “push,” “commit,” and so on are the DevOps alphabet. Therefore, getting better and succeeding in this field depends on being skilled with Git.
5. Ansible

Ansible is at the heart of many DevOps practices, an open-source automation tool that plays a pivotal role in infrastructure as code, configuration management, and application deployment. Mastery of Ansible skills has become increasingly important for professionals in the DevOps field, and here’s why.
Ansible allows teams to automate software provisioning, configuration management, and application deployment processes. This automation reduces the potential for human error and significantly increases efficiency, allowing teams to focus on more strategic tasks rather than repetitive manual work.
One of Ansible’s greatest strengths is its simplicity. Its use of YAML for playbook writing makes it accessible to those who may not have a strong background in scripting or programming, bridging the gap between development and operations teams.
In addition, what sets Ansible apart is that it’s agentless. This means there’s no need to install additional software on the nodes or servers it manages, reducing overhead and complexity. Instead, Ansible uses SSH for communication, further simplifying the setup and execution of tasks.
It also boasts a vast ecosystem of modules and plugins, making it compatible with a wide range of operating systems, cloud platforms, and software applications. This versatility ensures that DevOps professionals can manage complex, heterogeneous environments efficiently.
While it’s not mandatory for a DevOps engineer, like containers, Kubernetes, and Git are, you’ll hardly find a job listing for a DevOps role that doesn’t ask for skills to some level in Ansible or any of the other alternative automation tools, such as Chief, Puppet, etc. That’s why proficiency is more than advisable.
6. Jenkins

Jenkins is an open-source automation server that facilitates continuous integration and continuous delivery (CI/CD) practices, allowing teams to build, test, and deploy applications more quickly and reliably.
It works by monitoring a version control system for changes, automatically running tests on new code, and facilitating the deployment of passing builds to production environments.
Due to these qualities, just as Kubernetes is the go-to choice for container orchestration, Jenkins has become the go-to tool for CI/CD processes, automating the repetitive tasks involved in the software development lifecycle, such as building code, running tests, and deploying to production.
By integrating with a multitude of development, testing, and deployment tools, Jenkins serves as the backbone of a streamlined CI/CD pipeline. It enables developers to integrate changes to the project and makes it easier for teams to detect issues early on.
Proficiency in Jenkins is highly sought after in the DevOps field. As organizations increasingly adopt DevOps practices, the demand for professionals skilled in Jenkins and similar technologies continues to rise.
Mastery of it can open doors to numerous opportunities, from roles focused on CI/CD pipeline construction and maintenance to DevOps engineering positions.
7. Terraform / OpenTofu

In recent years, Terraform has emerged as a cornerstone for DevOps professionals. But what exactly is Terraform? Simply put, it’s a tool created by HashiCorp that allows you to define and provision infrastructure through code.
It allows developers and IT professionals to define their infrastructure using a high-level configuration language, enabling them to script the setup and provisioning of servers, databases, networks, and other IT resources. By doing so, Terraform introduces automation, repeatability, and consistency into the often complex infrastructure management process.
This approach, called Infrastructure as Code (IaC), allows infrastructure management to be automated and integrated into the development process, making it more reliable, scalable, and transparent.
With Terraform, DevOps professionals can seamlessly manage multiple cloud services and providers, deploying entire infrastructures with a single command. This capability is crucial in today’s multi-cloud environments, as it ensures flexibility, avoids vendor lock-in, and saves time and resources.
Moreover, it integrates very well with distributed version control systems such as Git, allowing teams to track and review changes to the infrastructure in the same way they manage application code.
However, HashiCorp recently updated Terraform’s licensing, meaning it’s no longer open source. The good news is that the Linux Foundation has introduced OpenTofu, a Terraform fork that’s fully compatible and ready for production use. We highly recommend putting your time and effort into OpenTofu.
8. Argo CD

Argo CD emerges as a beacon for modern DevOps practices. At its core, it’s a declarative GitOps continuous delivery tool for Kubernetes, where Git repositories serve as the source of truth for defining applications and their environments.
When developers push changes to a repository, Argo CD automatically detects these updates and synchronizes the changes to the specified environments, ensuring that the actual state in the cluster matches the desired state stored in Git, significantly reducing the potential for human error.
Mastery of Argo CD equips professionals with the ability to manage complex deployments efficiently at scale. This proficiency leads to several key benefits, the main one being enhanced automation.
By tying deployments to the version-controlled configuration in Git, Argo CD ensures consistency across environments. Moreover, it automates the deployment process, reducing manual errors and freeing up valuable time for DevOps teams to focus on more strategic tasks.
Furthermore, as applications and infrastructure grow, Argo CD’s capabilities allow teams to manage deployments across multiple Kubernetes clusters easily, supporting scalable operations without compromising control or security.
For professionals in the DevOps field, mastering Argo CD means being at the forefront of the industry’s move towards more automated, reliable, and efficient deployment processes. And last but not least, investing efforts in mastering Argo CD can significantly boost your career trajectory.
9. Prometheus

Let’s start with a short explanation of what Prometheus is and why it is crucial for DevOps professionals.
Prometheus is an open-source monitoring and alerting toolkit that has gained widespread adoption for its powerful and dynamic service monitoring capabilities. At its core, it collects and stores metrics in real-time as time series data, allowing users to query this data using its PromQL language.
This capability enables DevOps teams to track everything from CPU usage and memory to custom metrics that can be defined by the user, providing insights into the health and performance of their systems.
How does it work? Prometheus works by scraping metrics from configured targets at specified intervals, evaluating rule expressions, displaying the results, and triggering alerts if certain conditions are met. This design makes it exceptionally well-suited for environments with complex requirements for monitoring and alerting.
Overall, Prometheus is a critical skill for anyone in the DevOps field. Its ability to provide detailed, real-time insights into system performance and health makes it indispensable for modern, dynamic infrastructure management.
As systems become complex, the demand for skilled professionals who can leverage Prometheus effectively will only increase, making it a key competency for any DevOps career path.
10. Grafana

Grafana allows teams to visualize and analyze metrics from various sources, such as Prometheus, Elasticsearch, Loki, and many others, in comprehensive, easy-to-understand dashboards.
By transforming this numerical data into visually compelling graphs and charts, Grafana enables teams to monitor their IT infrastructure and services, providing real-time insights into application performance, system health, and more.
But why are Grafana’s skills so crucial in the DevOps field? Above all, they empower DevOps professionals to keep a vigilant eye on the system, identifying and addressing issues before they escalate, ensuring smoother operations and better service reliability.
Moreover, with Grafana, data from various sources can be aggregated and visualized in a single dashboard, making it a central monitoring location for all your systems.
On top of that, Grafana’s extensive customization options allow DevOps professionals to tailor dashboards to their specific needs. This flexibility is crucial in a field where requirements can vary greatly from one project to another.
In conclusion, mastering Grafana equips DevOps professionals with the skills to monitor, analyze, and optimize their systems effectively. Because of this, the ability to harness Grafana’s power will continue to be a valuable asset in any DevOps professional’s toolkit.
Conclusion
This list, curated by us, reflects the industry’s best practices and highlights the essential tools that every DevOps engineer should be familiar with to achieve professional success in today’s dynamic technological landscape.
Whether you are a newcomer or an experienced professional looking to enhance your skills, mastering these tools can significantly boost the trajectory of your DevOps career.
We’re confident that you might have some valuable additions to make to this list, and we’re eagerly looking forward to reading your suggestions in the comments section below. Thanks for sharing your time with us!