Friday, December 6, 2024

8 Linux Commands to Diagnose Hard Drive Issues in Linux

https://www.tecmint.com/fix-hard-drive-bottlenecks-in-linux

8 Linux Commands to Diagnose Hard Drive Issues in Linux

As a Linux expert with over a decade of experience managing servers, I have seen how crucial it is to identify and resolve hard drive bottlenecks to keep a system running smoothly.

Bottlenecks occur when a system’s performance is limited by a specific component, in this case, the hard drive, where slow disk operations can drastically affect the performance of your applications, databases, and even the entire system.

In this article, I will explain how to identify hard drive bottlenecks on Linux using various tools and commands, and what to look for when troubleshooting disk-related issues.

What is a Hard Drive Bottleneck?

A hard drive bottleneck happens when the disk cannot read or write data fast enough to keep up with the system’s demands. This often results in slow response times, lag, and even system crashes in extreme cases.

These bottlenecks are commonly caused by the following factors:

  • Overloaded Disk I/O: When the system has too many read/write requests, the disk cannot process them all at once.
  • Disk Fragmentation: On certain file systems, files may become fragmented, leading to inefficient disk usage and slower performance.
  • Hardware Limitations: Older disks or disks with smaller capacities may not be able to handle modern workloads.
  • Disk Errors: Physical problems with the hard drive, such as bad sectors, can also lead to performance issues.

How to Find Hard Drive (Disk) Bottlenecks in Linux

Here are some key Linux commands and tools that can help you identify and diagnose hard drive bottlenecks.

1. iostat (Input/Output Statistics)

iostat is a command-line utility that provides statistics on CPU and I/O usage for devices, helping you pinpoint disk bottlenecks.

iostat -x 1

Key Metrics to Look For:

  • %util: This represents how much time the disk was busy handling requests. If this number is consistently high (over 80-90%), it indicates the disk is a bottleneck.
  • await: This is the average time (in milliseconds) for a disk I/O request to complete. A high value indicates slow disk performance.
  • svctm: This represents the average service time for I/O requests. A high value means the disk is taking longer to respond.
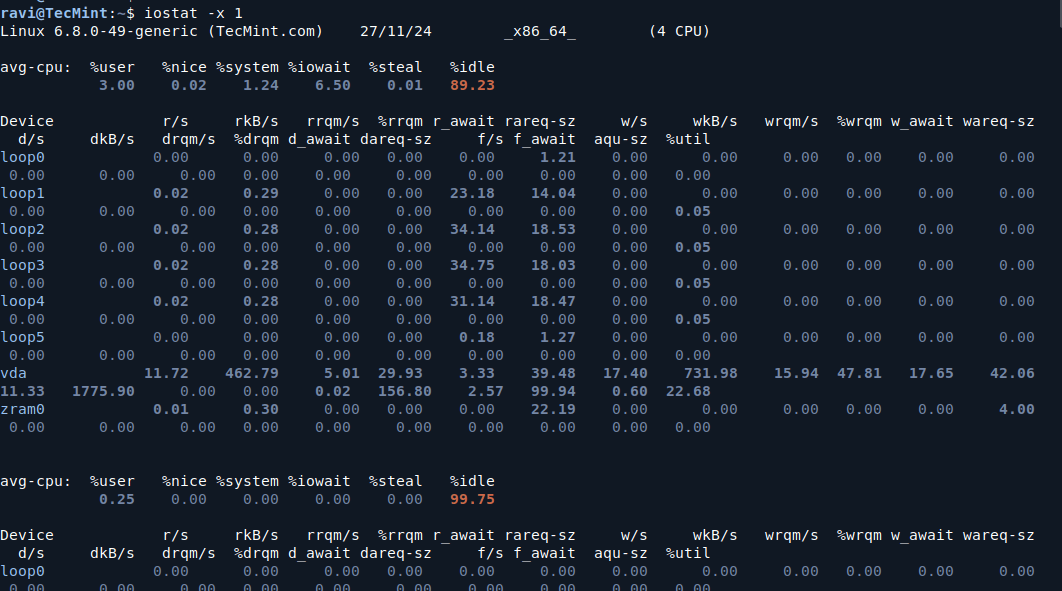
iostat: Monitor Disk I/O in Linux

2. iotop (I/O Monitoring in Real Time)

iotop is a real-time I/O monitoring tool that displays processes and their disk activity, which is useful for identifying which processes are consuming excessive disk bandwidth.

sudo iotop

This will show a list of processes that are performing disk I/O, along with the I/O read and write statistics.
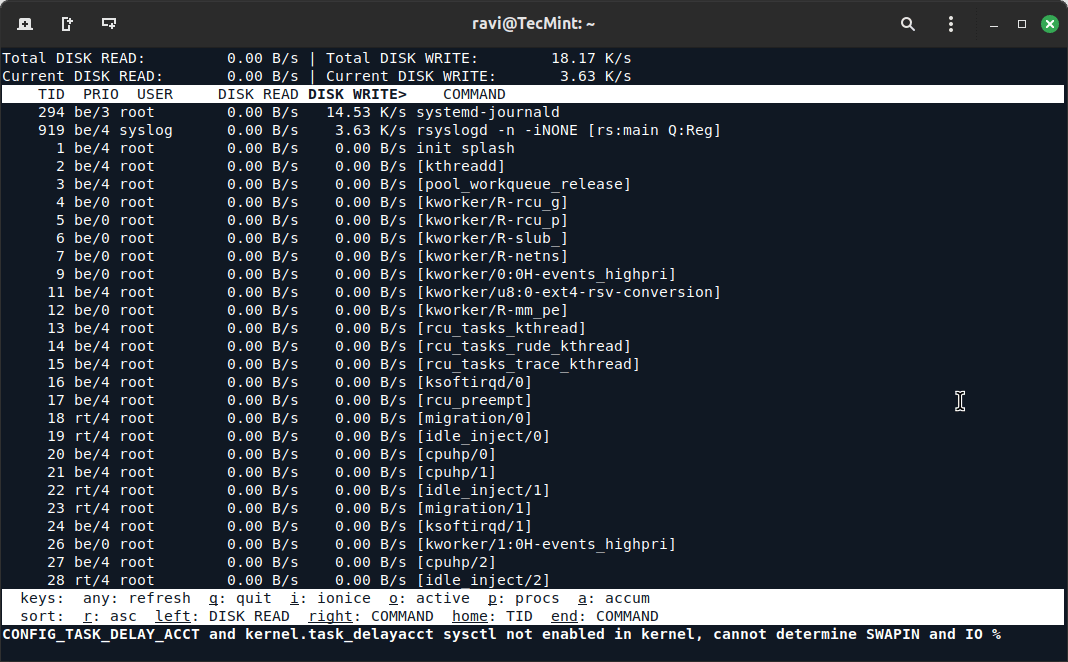
iotop: Real-time Disk I/O Monitoring Tool

Key Metrics to Look For:

  • Read/Write: Look for processes that have high read or write values. These processes might be causing the disk bottleneck.
  • IO Priority: Check if any process is consuming disproportionate I/O resources. You can adjust the priority of processes using ionice to manage how they interact with disk I/O.

3. df (Disk Free)

df command shows the disk space usage on all mounted filesystems. A nearly full disk can cause significant slowdowns, especially on the root or home partitions.

df -h

Ensure that disks, especially the root (/) and home (/home) directories, are not close to being full. If the disk is more than 85-90% full, it may start to slow down due to lack of space for temporary files and disk operations.
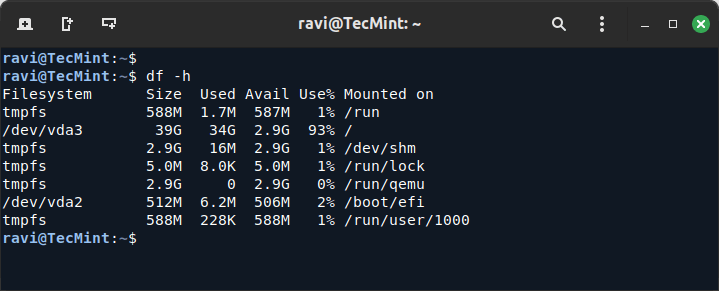
Check Disk Space Utilization

4. dstat (Comprehensive System Resource Monitoring)

dstat is a versatile tool for monitoring various system resources, including disk I/O, which provides a comprehensive overview of the system’s performance in real-time.

dstat -dny

Key Metrics to Look For:

  • disk read/write: Look for spikes in disk read/write activity. If you see constant heavy disk activity, it could indicate a bottleneck.
  • disk await: Shows how long each I/O operation takes. Long waits here mean a disk bottleneck.
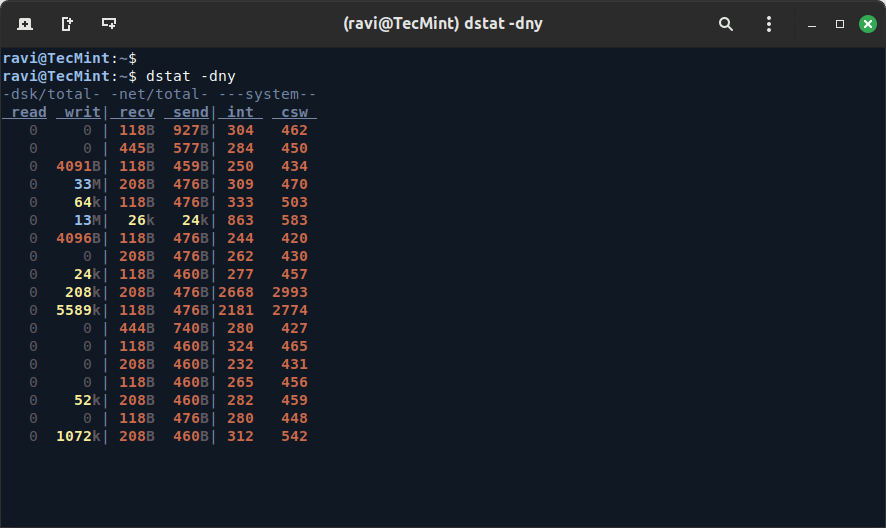
dstat - Versatile System Monitoring Tool
dstat – Versatile System Monitoring Tool

5. sar (System Activity Report)

The sar command is a powerful tool that collects, reports, and saves system activity information, which is ideal for historical performance analysis.

sar -d 1 5

Key Metrics to Look For:

  • tps: The number of transactions per second. A high value suggests the disk is handling a large number of I/O requests.
  • kB_read/s and kB_wrtn/s: The rate of data being read or written. If these numbers are unusually high, it may indicate a bottleneck.
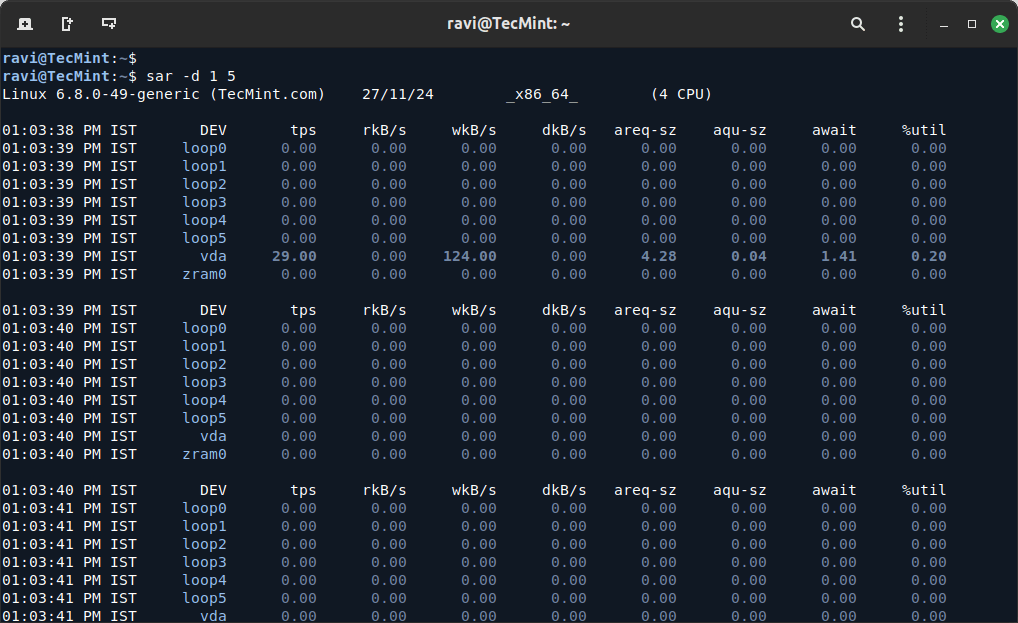
sar: System Activity Reporter

6. smartctl (S.M.A.R.T. Monitoring)

smartctl is used for checking the health of your hard drives by querying the S.M.A.R.T. (Self-Monitoring, Analysis, and Reporting Technology) status.

This can help identify physical issues with the disk, such as bad sectors or failing components.

sudo apt install smartmontools
sudo smartctl -a /dev/sda

Key Metrics to Look For:

  • Reallocated_Sector_Ct: The number of sectors that have been reallocated due to errors. A high value indicates the disk might be failing.
  • Seek_Error_Rate: High values suggest the disk may be having trouble seeking data, often a sign of physical damage.

7. lsblk (List Block Devices)

lsblk command lists all block devices on your system, such as hard drives and partitions, which is useful for getting an overview of your system’s storage devices.

lsblk -o NAME,SIZE,ROTA,TYPE,MOUNTPOINT

Ensure that your hard drives or partitions are not overloaded with too many tasks. SSDs (non-rotational) typically offer better performance than HDDs (rotational), and an overused rotational disk can lead to performance bottlenecks.
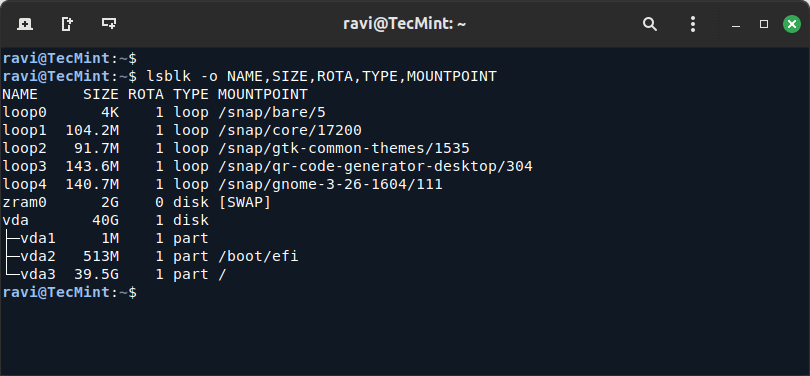
lsblk - List Block Devices
lsblk – List Block Devices

8. vmstat (Virtual Memory Statistics)

While vmstat primarily shows memory usage, it can also provide insight into disk I/O operations and how the system handles memory swapping.

vmstat 1

Key Metrics to Look For:

  • bi (blocks in): The number of blocks read from disk.
  • bo (blocks out): The number of blocks written to disk.
  • si and so (swap in and swap out): If these values are high, it means the system is swapping, which can be caused by insufficient RAM and heavy disk usage.
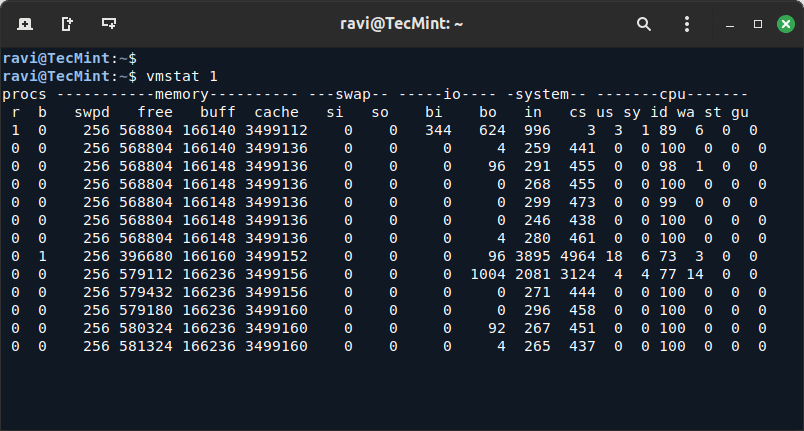
vmstat: Monitor Memory and Disk I/O
Conclusion

Hard drive bottlenecks can be caused by various factors, including overloaded disk I/O, hardware limitations, or disk errors. By using the tools and commands outlined in this article, you can effectively diagnose disk-related issues on your Linux system.

Monitoring tools like iostat, iotop, and dstat provide valuable insights into disk performance, while tools like smartctl can help you identify potential hardware failures.

As a seasoned Linux professional, I recommend regularly monitoring disk performance, especially in production environments, to ensure optimal system performance. Identifying and resolving bottlenecks early can save you from performance degradation and system downtime.


Wednesday, December 4, 2024

LineSelect: Interactively Select Single or Multiple Lines from Stdin

https://linuxtldr.com/lineselect-tool

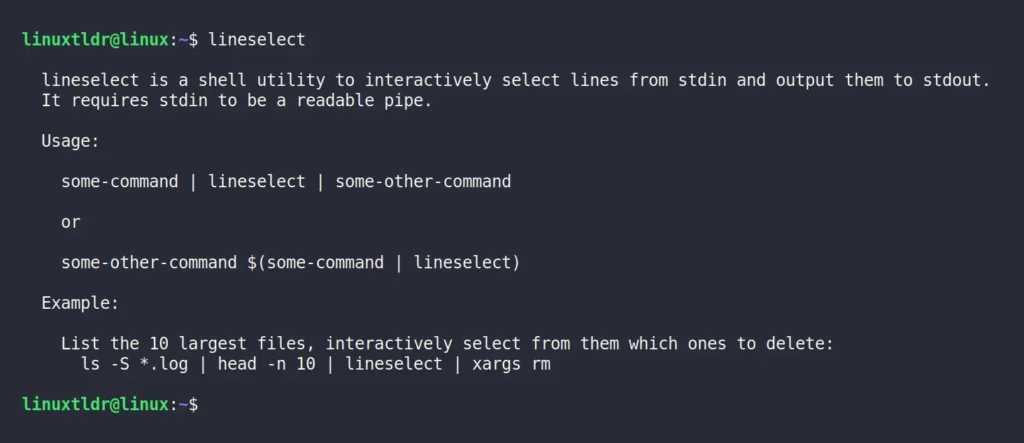
In this article, you will learn about a “lineselect” tool that allows you to interactively select single or multiple lines from stdin and output them to stdout, as shown.

What is LineSelect?

LineSelect is a free and open-source CLI tool that allows those working on the command line to interactively select single or multiple lines from stdin and output them to stdout.

I’d find it more useful when writing a shell script. Suppose you’re creating a shell script to administer a running Docker container. With this tool, you can allow users to interactively choose single or multiple running containers. After selection, you can use the stdout data to perform actions like checking container details, inspecting ports, stopping, deleting, etc.

Ezoic

This is one use case, but you can use it in various ways for different purposes in your shell script, and as a Node package, anyone with Node installed can effortlessly install it on their system.

So, in this article, I’ll show you how you can install LineSelect on Linux with command-line usage.

Tutorial Details

DescriptionLineSelect
Difficulty LevelLow
Root or Sudo PrivilegesNo
OS CompatibilityUbuntu, Manjaro, Fedora, etc.
Prerequisites
Internet RequiredYes (for installation)

How to Install LineSelect on Linux

LineSelect is available as a Node package, allowing easy installation for users. However, most Linux distros currently ship with an older version of Node that is incompatible with LineSelect. Therefore, if you have Node version <20, you can refer to our article on installing the latest version of Node.

Ezoic

Once you have it installed, run the following NPM command in your terminal to install LineSelect.

$ npm install -g lineselect

Once done, run the following command to verify it’s functioning without any errors:

$ lineselect

Output:

install lineselect

If you get the same output as shown above, it means you have properly installed LineSelect using the correct version of Node. Now, let’s see some usage examples…

Usage of LineSelect

To understand the use case of LineSelect within a command-line or shell script, you must first understand its basic workings by looking at the following syntax:

Ezoic
$ some-command | lineselect | some-othercommand

Here,

  • some-command” can be any command, such as “ls“, “docker ps“, “ps“, “ss“, etc.
  • lineselect” takes the output of the chosen command and provides an interactive interface for users to select single or multiple lines.
  • some-othercommand” will be a command where the user’s selected line will be redirected. Often, its “xargs” command is used, but it’s not limited to it.

When selecting single or multiple lines using LineSelect, remember to press the “Space” key first to select and then press “Enter” button to send the selected lines to the next command.

To showcase its use case, I’ll provide various command-line examples. Once you grasp its functionality, you can confidently use it in your own command or shell script. So, let’s start with…

1. Selecting one or more text files in the current directory using LineSelect, then removing them.

$ ls *.txt | lineselect | xargs rm

Output:

Here,

  • ls *.txt” will list all the text files in the current directory.
  • lineselect” takes the stdin of the listed file and allows user to select between them.
  • xargs rm” will take the user-selected file and delete it.

2. Selecting the running Docker containers with LineSelect, then halting the selected one.

$ docker stop $(docker ps -q | lineselect)

Output:

Here,

  • docker stop” will wait for the user action, then stop the selected Docker container.
  • $(docker ps -q | lineselect)” lists the IDs of the running Docker containers and allows users to select one or more.

3. Listing the currently running processes, selecting a single or multiple of them using LineSelect, and then killing the selected process.

$ kill -9 $(ps -a | lineselect | cut -d " " -f 4)

Output:

Here,

  • kill -9” will wait for the user action, then kill the selected process using the “SIGKILL” signal.
  • $(ps -a | lineselect | cut -d " " -f 4)” once the users have selected from the list of running processes, the cut command will receive the output and filter the first column from the selected line.

I’ll end the article here, but you can see how easy and useful it is to use while writing a shell script. Now, if you have any questions or concerns related to the topic, do let me know in the comment section.

Ezoic

Till then, peace!

Tuesday, November 26, 2024

10 Best Python Libraries Every Data Analyst Should Learn

https://www.tecmint.com/python-libraries-for-data-analysis

Python has become one of the most popular programming languages in the data analysis field due to its simplicity, flexibility, and powerful libraries which make it an excellent tool for analyzing data, creating visualizations, and performing complex analyses.

Whether you’re just starting as a data analyst or are looking to expand your toolkit, knowing the right Python libraries can significantly enhance your productivity in Python.

In this article, we’ll explore 10 Python libraries every data analyst should know, breaking them down into simple terms and examples of how you can use them to solve data analysis problems.

1. Pandas – Data Wrangling Made Easy

Pandas is an open-source library specifically designed for data manipulation and analysis. It provides two essential data structures: Series (1-dimensional) and DataFrame (2-dimensional), which make it easy to work with structured data, such as tables or CSV files.

Key Features:

  • Handling missing data efficiently.
  • Data aggregation and filtering.
  • Easy merging and joining of datasets.
  • Importing and exporting data from formats like CSV, Excel, SQL, and JSON.

Why Should You Learn It?

  • Data Cleaning: Pandas help in handling missing values, duplicates, and data transformations.
  • Data Exploration: You can easily filter, sort, and group data to explore trends.
  • File Handling: Pandas can read and write data from various file formats like CSV, Excel, SQL, and more.

Basic example of using Pandas:

import pandas as pd

# Create a DataFrame
data = {'Name': ['Alice', 'Bob', 'Charlie'], 'Age': [25, 30, 35], 'City': ['New York', 'Paris', 'London']}
df = pd.DataFrame(data)

# Filter data
filtered_data = df[df['Age'] > 28]
print(filtered_data)

2. NumPy – The Foundation for Data Manipulation

NumPy (Numerical Python) is the most fundamental Python library for numerical computing, which provides support for large, multi-dimensional arrays and matrices, along with a wide variety of mathematical functions to operate on them.

NumPy is often the foundation for more advanced libraries like Pandas, and it’s the go-to library for any operation involving numbers or large datasets.

Key Features:

  • Mathematical functions (e.g., mean, median, standard deviation).
  • Random number generation.
  • Element-wise operations for arrays.

Why Should You Learn It?

  • Efficient Data Handling: NumPy arrays are faster and use less memory compared to Python lists.
  • Mathematical Operations: You can easily perform operations like addition, subtraction, multiplication, and other mathematical operations on large datasets.
  • Integration with Libraries: Many data analysis libraries, including Pandas, Matplotlib, and Scikit-learn, depend on NumPy for handling data.

Basic example of using NumPy:

import numpy as np

# Create a NumPy array
arr = np.array([1, 2, 3, 4, 5])

# Perform element-wise operations
arr_squared = arr ** 2
print(arr_squared)  # Output: [ 1  4  9 16 25]

3. Matplotlib – Data Visualization

Matplotlib is a powerful visualization library that allows you to create a wide variety of static, animated, and interactive plots in Python.

It’s the go-to tool for creating graphs such as bar charts, line plots, scatter plots, and histograms.

Key Features:

  • Line, bar, scatter, and pie charts.
  • Customizable plots.
  • Integration with Jupyter Notebooks.

Why Should You Learn It?

  • Customizable Plots: You can fine-tune the appearance of plots (colors, fonts, styles).
  • Wide Range of Plots: From basic plots to complex visualizations like heatmaps and 3D plots.
  • Integration with Libraries: Matplotlib works well with Pandas and NumPy, making it easy to plot data directly from these libraries.

Basic example of using Matplotlib:

import matplotlib.pyplot as plt

# Sample data
x = [1, 2, 3, 4, 5]
y = [2, 4, 6, 8, 10]

# Create a line plot
plt.plot(x, y)
plt.title('Line Plot Example')
plt.xlabel('X-axis')
plt.ylabel('Y-axis')
plt.show()

4. Seaborn – Advanced Statistical Visualizations

Seaborn is built on top of Matplotlib and provides a high-level interface for drawing attractive and informative statistical graphics.

It simplifies the process of creating complex visualizations like box plots, violin plots, and pair plots.

Key Features:

  • Beautiful default styles.
  • High-level functions for complex plots like heatmaps, violin plots, and pair plots.
  • Integration with Pandas.

Why Should You Learn It?

  • Statistical Visualizations: Seaborn makes it easy to visualize the relationship between different data features.
  • Enhanced Aesthetics: It automatically applies better styles and color schemes to your plots.
  • Works with Pandas: You can directly plot DataFrames from Pandas.

Basic example of using Seaborn:

import seaborn as sns
import matplotlib.pyplot as plt

# Load a sample dataset
data = sns.load_dataset('iris')

# Create a pairplot
sns.pairplot(data, hue='species')
plt.show()

5. Scikit-learn – Machine Learning Made Easy

Scikit-learn is a widely-used Python library for machine learning, which provides simple and efficient tools for data mining and data analysis, focusing on supervised and unsupervised learning algorithms.

Key Features:

  • Preprocessing data.
  • Supervised and unsupervised learning algorithms.
  • Model evaluation and hyperparameter tuning.

Why Should You Learn It?

  • Machine Learning Models: Scikit-learn offers a variety of algorithms such as linear regression, decision trees, k-means clustering, and more.
  • Model Evaluation: It provides tools for splitting datasets, evaluating model performance, and tuning hyperparameters.
  • Preprocessing Tools: Scikit-learn has built-in functions for feature scaling, encoding categorical variables, and handling missing data.

Basic example of using Scikit-learn:

from sklearn.linear_model import LinearRegression
from sklearn.model_selection import train_test_split
from sklearn.datasets import load_boston

# Load dataset
data = load_boston()
X = data.data
y = data.target

# Split dataset into training and testing sets
X_train, X_test, y_train, y_test = train_test_split(X, y, test_size=0.2, random_state=42)

# Train a linear regression model
model = LinearRegression()
model.fit(X_train, y_train)

# Predict and evaluate
predictions = model.predict(X_test)
print(predictions[:5])  # Display first 5 predictions

6. Statsmodels – Statistical Models and Tests

Statsmodels is a Python library that provides classes and functions for statistical modeling. It includes tools for performing hypothesis testing, fitting regression models, and conducting time series analysis.

Key Features:

  • Regression models.
  • Time-series analysis.
  • Statistical tests.

Why Should You Learn It?

  • Regression Analysis: Statsmodels offers multiple regression techniques, including ordinary least squares (OLS) and logistic regression.
  • Statistical Tests: It provides many statistical tests, such as t-tests, chi-square tests, and ANOVA.
  • Time Series Analysis: Statsmodels is useful for analyzing and forecasting time-dependent data.

Basic example of using Statsmodels:

import statsmodels.api as sm
import numpy as np

# Sample data
X = np.random.rand(100)
y = 2 * X + np.random.randn(100)

# Fit a linear regression model
X = sm.add_constant(X)  # Add a constant term for the intercept
model = sm.OLS(y, X).fit()

# Print summary of the regression results
print(model.summary())

7. SciPy – Advanced Scientific and Technical Computing

SciPy is an open-source library that builds on NumPy and provides additional functionality for scientific and technical computing.

It includes algorithms for optimization, integration, interpolation, eigenvalue problems, and other advanced mathematical operations.

Key Features:

  • Optimization.
  • Signal processing.
  • Statistical functions.

Why Should You Learn It?

  • Scientific Computing: SciPy includes a wide range of tools for solving complex mathematical problems.
  • Optimization Algorithms: It provides methods for finding optimal solutions to problems.
  • Signal Processing: Useful for filtering, detecting trends, and analyzing signals in data.

Basic example of using SciPy:

from scipy import stats
import numpy as np

# Perform a t-test
data1 = np.random.normal(0, 1, 100)
data2 = np.random.normal(1, 1, 100)

t_stat, p_val = stats.ttest_ind(data1, data2)
print(f'T-statistic: {t_stat}, P-value: {p_val}')

8. Plotly – Interactive Visualizations

Plotly is a library for creating interactive web-based visualizations. It allows you to create plots that users can zoom in, hover over, and interact with.

Key Features:

  • Interactive plots.
  • Support for 3D plots.
  • Dash integration for building dashboards.

Why Should You Learn It?

  • Interactive Plots: Plotly makes it easy to create graphs that allow users to interact with the data.
  • Web Integration: You can easily integrate Plotly plots into web applications or share them online.
  • Rich Visualizations: It supports a wide variety of visualizations, including 3D plots, heatmaps, and geographical maps.

Basic example of using Plotly:

import plotly.express as px

# Sample data
data = px.data.iris()

# Create an interactive scatter plot
fig = px.scatter(data, x='sepal_width', y='sepal_length', color='species')
fig.show()

9. OpenPyXL – Working with Excel Files

OpenPyXL is a Python library that allows you to read and write Excel .xlsx files. It’s a useful tool when dealing with Excel data, which is common in business and finance settings.

Key Features:

  • Read and write .xlsx files.
  • Add charts to Excel files.
  • Automate Excel workflows.

Why Should You Learn It?

  • Excel File Handling: Openpyxl enables you to automate Excel-related tasks such as reading, writing, and formatting data.
  • Data Extraction: You can extract specific data points from Excel files and manipulate them using Python.
  • Create Reports: Generate automated reports directly into Excel.

Basic example of using OpenPyXL:

from openpyxl import Workbook

# Create a new workbook and sheet
wb = Workbook()
sheet = wb.active

# Add data to the sheet
sheet['A1'] = 'Name'
sheet['B1'] = 'Age'

# Save the workbook
wb.save('data.xlsx')

10. BeautifulSoup – Web Scraping

BeautifulSoup is a powerful Python library used for web scraping – that is, extracting data from HTML and XML documents. It makes it easy to parse web pages and pull out the data you need.

If you’re dealing with web data that isn’t available in an easy-to-use format (like a CSV or JSON), BeautifulSoup helps by allowing you to interact with the HTML structure of a web page.

Key Features:

  • Parsing HTML and XML documents.
  • Finding and extracting specific elements (e.g., tags, attributes).
  • Integration with requests for fetching data.

Why Should You Learn It?

  • Web Scraping: BeautifulSoup simplifies the process of extracting data from complex HTML and XML documents.
  • Compatibility with Libraries: It works well with requests for downloading web pages and pandas for storing the data in structured formats.
  • Efficient Searching: You can search for elements by tag, class, id, or even use CSS selectors to find the exact content you’re looking for.
  • Cleaning Up Data: Often, the data on websites is messy. BeautifulSoup can clean and extract the relevant parts, making it easier to analyze.

Basic example of using BeautifulSoup:

from bs4 import BeautifulSoup
import requests

# Fetch the web page content using requests
url = 'https://example.com'
response = requests.get(url)

# Parse the HTML content of the page
soup = BeautifulSoup(response.text, 'html.parser')

# Find a specific element by tag (for example, the first <h1> tag)
h1_tag = soup.find('h1')

# Print the content of the <h1> tag
print(h1_tag.text)
Conclusion

Whether you’re cleaning messy data, visualizing insights, or building predictive models, these tools provide everything you need to excel in your data analyst career. Start practicing with small projects, and soon, you’ll be solving real-world data challenges with ease.