http://xmodulo.com/server-monitoring-system-monit.html
Many Linux admins rely on a centralized remote monitoring system (e.g., Nagios or Cacti) to check the health of their network infrastructure. While centralized monitoring makes an admin's life easy when dealing with many hosts and devices, a dedicated monitoring box obviously becomes a single point of failure; if the monitoring box goes down or becomes unreachable for whatever reason (e.g., bad hardware or network outage), you will lose visibility on your entire infrastructure.
One way to add redundancy to your monitoring system is to install standalone monitoring software (as a fallback) at least on any critical/core servers on your network. In case a centralized monitor is down, you will still be able to maintain visibility on your core servers from their backup monitor.
I have been using Monit for several years on multiple hosts, and I am very pleased how reliable it has been. Even as a full-blown monitoring system, Monit is very useful and powerful for any Linux admin. In this tutorial, let me demonstrate how to set up Monit on a local server (as a backup monitor) to monitor common services. With this setup, I will only scrach the surface of what Monit can do for us.
Debian, Ubuntu or Linux Mint:
On CentOS/RHEL, you must enable either EPEL or Repoforge repository first.
First, generate and store a self-signed certificate (monit.pem) in /var/cert.
As you can see, Monit offers several built-in variables ($DATE,
$EVENT, $HOST, etc.), and you can customize your email message for your
needs. If you want to send mails from the Monit host itself, you need a
sendmail-compatible program (e.g., postfix or ssmtp) already installed.
We must also define "idfile", a unique ID used by monit demon, and "eventqueue", a path where mails sent by monit
but undelivered due to SMTP/network errors. Verifiy that path
(/var/monit) already exists. The following configuration will do.
Now it is time to check what we have done. You can test an existing configuration file (/etc/monit.conf) by running:
:1966.
Replace & with your Monit hostname or IP
address.
Note that if you have a self-signed SSL certificate, you will see a warning message in your browser.

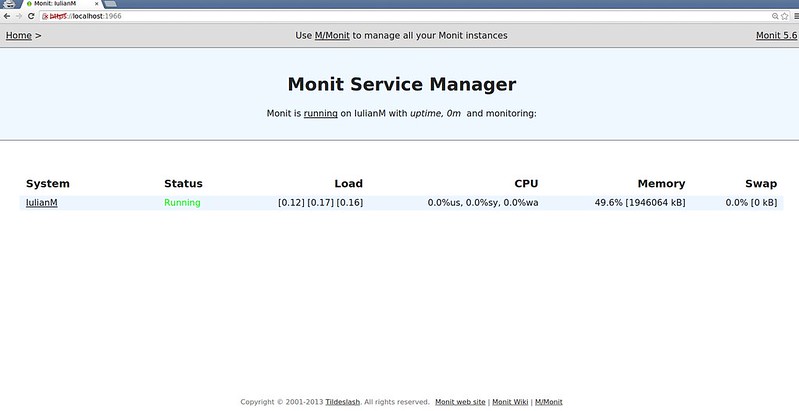
After you have completed login, you must see the following page.

In the rest of the tutorial, let me show how we can monitor a local server and common services. You will see a lot of useful examples on the official wiki page. Most of them are copy-and-pastable!
You can easily interpret the above configuration. The above checks
are performed on local host for every monitoring cycle (which is set to
120 seconds in the Global section). If any condition is met, monit daemon will send an alert with an email.
If certain properties do not need to be monitored for every cycle, you can use the following format. For example, this will monitor average load every other cycle (i.e., every 240 seconds).
We also want to check if the init script for sshd exist:
Finally, we want to check if sshd daemon is up an running, and listens on port 22:
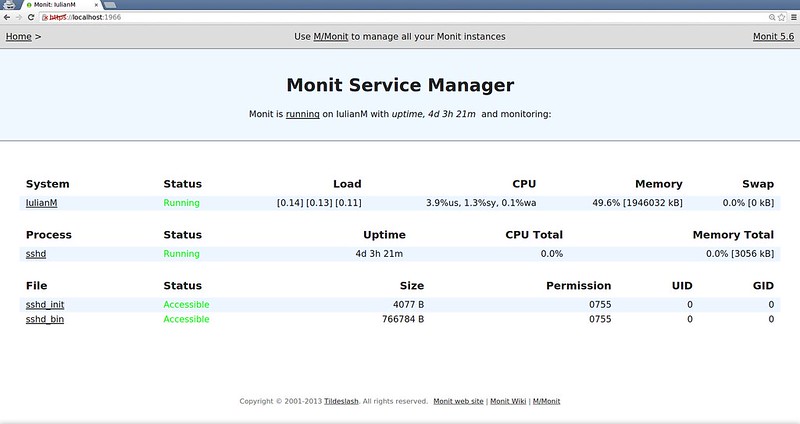
More specifically, we can interpret the above configuration as follows. We check if a process named sshd and a pidfile (/var/run/sshd.pid) exist. If either one does not exist, we restart sshd demon using init script. We check if a process listening on port 22 can speak SSH protocol. If not, we restart sshd daemon. If there are at least 5 restarts within the last 5 monitoring cycles (i.e., 5x120 seconds), sshd daemon is declared non-functional, and we do not try to check again.

We check if the remote host responds to ICMP. If we haven't received
ICMP response within 10 cycles, we send out an alert. If testing for
SMTP protocol on port 25 fails, we send out an alert. If testing
succeeds again after a failed test, we run a script
(/scripts/mail-script). If testing for SSH and IMAP protocols fail on
port 22 and 143, respectively, we send out an alert.
Many Linux admins rely on a centralized remote monitoring system (e.g., Nagios or Cacti) to check the health of their network infrastructure. While centralized monitoring makes an admin's life easy when dealing with many hosts and devices, a dedicated monitoring box obviously becomes a single point of failure; if the monitoring box goes down or becomes unreachable for whatever reason (e.g., bad hardware or network outage), you will lose visibility on your entire infrastructure.
One way to add redundancy to your monitoring system is to install standalone monitoring software (as a fallback) at least on any critical/core servers on your network. In case a centralized monitor is down, you will still be able to maintain visibility on your core servers from their backup monitor.
What is Monit?
Monit is a cross-platform open-source tool for monitoring Unix/Linux systems (e.g., Linux, BSD, OSX, Solaris). Monit is extremely easy to install and reasonably lightweight (with only 500KB in size), and does not require any third-party programs, plugins or libraries. Yet, Monit lends itself to full-blown monitoring, capable of process status monitoring, filesystem change monitoring, email notification, customizable actions for core services, and so on. The combination of ease of setup, lightweight implementation and powerful features makes Monit an ideal candidate for a backup monitoring tool.I have been using Monit for several years on multiple hosts, and I am very pleased how reliable it has been. Even as a full-blown monitoring system, Monit is very useful and powerful for any Linux admin. In this tutorial, let me demonstrate how to set up Monit on a local server (as a backup monitor) to monitor common services. With this setup, I will only scrach the surface of what Monit can do for us.
Installation of Monit on Linux
Most Linux distributions already include Monit in their repositories.Debian, Ubuntu or Linux Mint:
$ sudo aptitude install monit
Fedora or CentOS/RHEL:On CentOS/RHEL, you must enable either EPEL or Repoforge repository first.
# yum install monit
Monit comes with a very well documented configuration file with a
lots of examples. The main configuration file is located in
/etc/monit.conf in Fedora/CentOS/RHEL, or /etc/monit/monitrc in
Debian/Ubuntu/Mint. Monit configuration has two parts: "Global" and
"Services" sections. Global Configuration: Web Status Page
Monit can use several mail servers for notifications, and/or an HTTP/HTTPS status page. Let's start with the web status page with the following requirements.- Monit listens on port 1966.
- Access to the web status page is encrypted with SSL.
- Login requires monituser/romania as user/password.
- Login is permitted from localhost, myhost.mydomain.ro, and internal LAN (192.168.0.0/16) only.
- Monit stores an SSL certificate in a pem format.
First, generate and store a self-signed certificate (monit.pem) in /var/cert.
# mkdir /var/certs
# cd /etc/pki/tls/certs
# ./make-dummy-cert monit.pem
# cp monit.pem /var/certs
# chmod 0400 /var/certs/monit.pem
Now put the following snippet in the Monit's main configuration file.
You can start with an empty configuration file or make a copy of the
original file.# cd /etc/pki/tls/certs
# ./make-dummy-cert monit.pem
# cp monit.pem /var/certs
# chmod 0400 /var/certs/monit.pem
1
2
3
4
5
6
7
| set httpd port 1966 and SSL ENABLE PEMFILE /var/certs/monit.pem allow monituser:romania allow localhost allow 192.168.0.0/16 allow myhost.mydomain.ro |
Global Configuration: Email Notification
Next, let's set up email notification in Monit. We need at least one active SMTP server which can send mails from the Monit host. Something like the following will do (adjust it for your case):- Mail server hostname: smtp.monit.ro
- Sender email address used by monit (from): monit@monit.ro
- Who will receive mail from monit daemon: guletz@monit.ro
- SMTP port used by mail server: 587 (default is 25)
1
2
3
4
5
6
7
8
9
10
11
12
| set mailserver smtp.monit.ro port 587set mail-format { from: monit@monit.ro subject: $SERVICE $EVENT at $DATE on $HOST message: Monit $ACTION $SERVICE $EVENT at $DATE on $HOST : $DESCRIPTION. Yours sincerely, Monit }set alert guletz@monit.ro |
Global Configuration: Monit Daemon
The next part is setting up monit daemon. We will set it up as follows.- Performs the first check after 120 seconds.
- Checks services once every 3 minutes.
- Use syslog for logging.
1
2
3
| set daemon 120 with start delay 240set logfile syslog facility log_daemon |
1
2
3
| set idfile /var/monit/id set eventqueue basedir /var/monit |
Test Global Configuration
Now the "Global" section is finished. The Monit configuration file will look like this:
1
2
3
4
5
6
7
8
9
10
11
12
13
14
15
16
17
18
19
20
21
22
23
24
25
26
27
28
29
30
31
32
33
34
35
| # Global Section# status webpage and acl'sset httpd port 1966 and SSL ENABLE PEMFILE /var/certs/monit.pem allow monituser:romania allow localhost allow 192.168.0.0/16 allow myhost.mydomain.ro# mail-server set mailserver smtp.monit.ro port 587# email-formatset mail-format { from: monit@monit.ro subject: $SERVICE $EVENT at $DATE on $HOST message: Monit $ACTION $SERVICE $EVENT at $DATE on $HOST : $DESCRIPTION. Yours sincerely, Monit }set alert guletz@monit.ro# delay checksset daemon 120 with start delay 240set logfile syslog facility log_daemon# idfile and mail queue pathset idfile /var/monit/id set eventqueue basedir /var/monit |
# monit -t
Control file syntax OKIf Monit complains about any error, please review the configuration file again. Fortunately, error/warnings messages are informative. For example:
monit: Cannot stat the SSL server PEM file '/var/certs/monit.pem' -- No such file or directory
/etc/monit/monitrc:10: Warning: hostname did not resolve 'smtp.monit.ro'
Once you verify the syntax of configuration, start monit daemon, and wait 2 to 3 minutes:
# service monit start
If you are using systemd, run:
# systemctl start monit
Now open a browser window, and go to https://Note that if you have a self-signed SSL certificate, you will see a warning message in your browser.

After you have completed login, you must see the following page.

In the rest of the tutorial, let me show how we can monitor a local server and common services. You will see a lot of useful examples on the official wiki page. Most of them are copy-and-pastable!
Service Configuration: CPU/Memory Monitoring
Let start with monitoring a local server's CPU/memory usage. Copy the following snippet in the configuration file.
1
2
3
4
5
6
7
| check system localhost if loadavg (1min) > 10 then alert if loadavg (5min) > 6 then alert if memory usage > 75% then alert if cpu usage (user) > 70% then alert if cpu usage (system) > 60% then alert if cpu usage (wait) > 75% then alert |
If certain properties do not need to be monitored for every cycle, you can use the following format. For example, this will monitor average load every other cycle (i.e., every 240 seconds).
1
| if loadavg (1min) > 10 for 2 cycles then alert |
Service Configuration: SSH Service Monitoring
Let's check if we have sshd binary installed in /usr/sbin/sshd:
1
| check file sshd_bin with path /usr/sbin/sshd |
1
| check file sshd_init with path /etc/init.d/sshd |
1
2
3
4
5
| check process sshd with pidfile /var/run/sshd.pid start program "/etc/init.d/sshd start" stop program "/etc/init.d/sshd stop" if failed port 22 protocol ssh then restart if 5 restarts within 5 cycles then timeout |

Service Configuration: SMTP Service Monitoring
Now let's set up a check on a remote SMTP mail server (e.g., 192.168.111.102). Let's assume that the SMTP server is running SMTP, IMAP and SSH on its LAN interface.
1
2
3
4
5
6
| check host MAIL with address 192.168.111.102 if failed icmp type echo within 10 cycles then alert if failed port 25 protocol smtp then alert else if recovered then exec "/scripts/mail-script" if failed port 22 protocol ssh then alert if failed port 143 protocol imap then alert |

No comments:
Post a Comment