http://fedoramagazine.org/systemd-using-journal
 Welcome back to our continuing series on systemd. The
powerful startup and management system contains many useful functions.
One is journald, which logs data about your system and the
services it runs. Knowing more about the journal helps you easily
discover information and troubleshoot when necessary.
Since the journal is persistent, the journal could cover months of system logs. You might not want to page through all that output. If you’re looking for data from the most recent system boot, for example, you can use -b to show just that information:
If you use the -o switch, you can switch the output format for the journal. By default, the journal uses the short format, which mimics syslog. However, the verbose setting will show you metadata for each journal entry:
But what about previous times before the system was rebooted? You can tell the journal to show you all recorded boot sessions:
And by the way, you can use the Tab key to autocomplete the boot ID, to avoid an error in typing. Not only that, but you can autocomplete the field name too, For instance, type journalctl _B[Tab] and the field completes. Then you could type 1c[Tab] using our example above, and the value completes:
You may have seen this application earlier. In fact, we reported about it in Fedora Magazine in this post for Fedora 21. You’ll be happy to know it is now lightning-fast, and loads messages on demand.

The log messages are separated by what generated the message. To choose a different category, click it on the left side of the app. You can also choose a specific boot session to examine logs. Click on the date and time header control to select the session you prefer. You can also search for specific issues using the search tool. Finally, to display details on any log message, click the message in the list.
Hopefully this article has shown you some useful and interesting ways to use the journal. For additional helpful information, refer to this blog entry in the original “systemd for administrators” series. Happy logging!

Basic journal use
The journalctl command lets you interact with the journal. By default, journalctl shows you the entire journal content:journalctlIf you’re not new to Linux, you’ll recall that older systems use syslog to record log data. You’ll notice the output of the journal looks very much like syslog output. Here’s an example from my host. Don’t worry if you don’t know what any of this means. These are messages from booting the system recently.
-- Logs begin at Fri 2015-11-06 16:55:01 EST, end at Tue 2015-11-10 17:01:23 EST. --
Nov 06 16:55:01 scarlett systemd-journal[200]: Runtime journal is using 8.0M (max allowed 297.9M, trying to leave 446.9M free of 2.9G available → current limit 297.9M).
Nov 06 16:55:01 scarlett systemd-journal[200]: Runtime journal is using 8.0M (max allowed 297.9M, trying to leave 446.9M free of 2.9G available → current limit 297.9M).
Nov 06 16:55:01 scarlett kernel: microcode: CPU0 microcode updated early to revision 0x19, date = 2013-06-21
Nov 06 16:55:01 scarlett kernel: Initializing cgroup subsys cpuset
Nov 06 16:55:01 scarlett kernel: Initializing cgroup subsys cpu
Nov 06 16:55:01 scarlett kernel: Initializing cgroup subsys cpuacct
Nov 06 16:55:01 scarlett kernel: Linux version 4.2.5-300.fc23.x86_64 (mockbuild@bkernel02.phx2.fedoraproject.org) (gcc version 5.1.1 20150618 (Red Hat 5.1.1-4) (GCC) ) #1 SMP Tue Oct 27 04:29:56 UTC 2015
Nov 06 16:55:01 scarlett kernel: Command line: BOOT_IMAGE=/vmlinuz-4.2.5-300.fc23.x86_64 root=/dev/mapper/fedora_scarlett-root ro rd.lvm.lv=fedora_scarlett/root rhgb quiet LANG=en_US.UTF-8
Nov 06 16:55:01 scarlett kernel: x86/fpu: Legacy x87 FPU detected.
Nov 06 16:55:01 scarlett kernel: x86/fpu: Using 'lazy' FPU context switches.
Nov 06 16:55:01 scarlett kernel: e820: BIOS-provided physical RAM map:
Nov 06 16:55:01 scarlett kernel: BIOS-e820: [mem 0x0000000000000000-0x000000000009ebff] usable
Nov 06 16:55:01 scarlett kernel: BIOS-e820: [mem 0x000000000009ec00-0x000000000009ffff] reserved
Nov 06 16:55:01 scarlett kernel: BIOS-e820: [mem 0x00000000000e4000-0x00000000000fffff] reserved
Nov 06 16:55:01 scarlett kernel: BIOS-e820: [mem 0x0000000000100000-0x00000000bf75ffff] usable
Nov 06 16:55:01 scarlett kernel: BIOS-e820: [mem 0x00000000bf760000-0x00000000bf76dfff] ACPI data
Nov 06 16:55:01 scarlett kernel: BIOS-e820: [mem 0x00000000bf76e000-0x00000000bf7a7fff] ACPI NVS
Nov 06 16:55:01 scarlett kernel: BIOS-e820: [mem 0x00000000bf7a8000-0x00000000bf7dffff] reserved
Nov 06 16:55:01 scarlett kernel: BIOS-e820: [mem 0x00000000bf7eb800-0x00000000bfffffff] reserved
The journal uses a pager by default, so you can use arrow and PgUp/PgDn keys to move around. Try it out, and notice that some lines are highlighted. Error messages, for instance, appear in red.
Since the journal is persistent, the journal could cover months of system logs. You might not want to page through all that output. If you’re looking for data from the most recent system boot, for example, you can use -b to show just that information:
journalctl -bBut for many people this also is a lot to look through. This is especially true if you’re troubleshooting a specific service problem. Let’s say you’re trying to identify a problem with NetworkManager. You can filter the journal by systemd unit using the -u switch:
journalctl -b -u NetworkManagerBut what if your system has been up for weeks or months? That’s not uncommon with a Linux operating system like Fedora, after all. Fortunately you can also filter by time:
journalctl -b -u NetworkManager --since='yesterday'Even more specifically, you can find errors by filtering on priority with -p. These priorities are the same as used in the old syslog system, such as err for errors, or warning for warnings.
journalctl -b -u NetworkManager --since='yesterday' -p err
Journal metadata
But there’s a lot more to the journal than meets the eye. Each entry in the journal includes a large set of metadata.If you use the -o switch, you can switch the output format for the journal. By default, the journal uses the short format, which mimics syslog. However, the verbose setting will show you metadata for each journal entry:
$ journalctl -b -u NetworkManager --since='yesterday' -o verbose
Sun 2015-11-08 00:25:43.491639 EST [s=fdcd66beb0fc4bb1b46acabbb548fd69;i=e264b;b=a8ff73d157c541abbfaca338ecddccba;m=7192b31e50;t=52400b547291a;x=4a57fe2915e9a6c3]
 _MACHINE_ID=e72f725410ac48dfb979ead85d8ff44f
 _HOSTNAME=localhost
 _SYSTEMD_SLICE=system.slice
 _TRANSPORT=syslog
 _UID=0
 _GID=0
 SYSLOG_FACILITY=3
 PRIORITY=6
 SYSLOG_IDENTIFIER=dhclient
 _COMM=dhclient
 _EXE=/usr/sbin/dhclient
 _CAP_EFFECTIVE=203402
 _SYSTEMD_CGROUP=/system.slice/NetworkManager.service
 _SYSTEMD_UNIT=NetworkManager.service
 _SELINUX_CONTEXT=system_u:system_r:dhcpc_t:s0
 _CMDLINE=/sbin/dhclient -d -q -sf /usr/libexec/nm-dhcp-helper -pf /var/run/dhclient-wlp2s0.pid -lf /var/lib/NetworkManager/dhclient-d989668a-f8d3-4729-a2b0-d02b244e0161-wlp2s0.lease -cf /
 _BOOT_ID=a8ff73d157c541abbfaca338ecddccba
 SYSLOG_PID=2027
 _PID=2027
 MESSAGE=DHCPREQUEST on wlp2s0 to 192.168.1.254 port 67 (xid=0x6c674a2a)
 _SOURCE_REALTIME_TIMESTAMP=1446960343491639
Using fields
You can filter the journal on any of these fields as well. Take for example the useful _BOOT_ID field. This field lets systemd identify the boot session to which a log entry belongs. As we already saw, there’s already a journalctl -b option to show only log entries from the most recent boot.But what about previous times before the system was rebooted? You can tell the journal to show you all recorded boot sessions:
$ journalctl --list-boots
-2 d30ee3a4f9ac4104aee3940d844e41fa Wed 2015-09-30 14:42:41 EDT—Wed 2015-09-30 14:58:03 EDT
-1 1c677fd72e82413bb68fe95f10524aef Fri 2015-10-23 11:02:15 EDT—Mon 2015-11-02 08:55:44 EST
 0 a8ff73d157c541abbfaca338ecddccba Mon 2015-11-02 08:55:51 EST—Sun 2015-11-08 21:01:01 EST
As you can see, the most recent boot session ID matches that in the journal entry above (starting with a8ff73d1…). This makes sense, because we requested the journal only show entries since the most recent boot. But now we can specifically request messages from the previous boot session.
And by the way, you can use the Tab key to autocomplete the boot ID, to avoid an error in typing. Not only that, but you can autocomplete the field name too, For instance, type journalctl _B[Tab] and the field completes. Then you could type 1c[Tab] using our example above, and the value completes:
journalctl _BOOT_ID=1c677fd72e82413bb68fe95f10524aef -u NetworkManagerAnother useful field is _COMM. You can use this to filter by a specific executable that may have resulted in an error. For instance, the NetworkManager service launches the dhclient executable to get a network address for your Fedora system. If your system is not getting an address, you might want to see just the journal messages from dhclient:
journalctl _COMM=dhclient --since='2 hours ago'If you want to know the available values for any field, you can use the -F switch. Notice how this command, for instance, shows you similar information to –list-boots:
journalctl -F _BOOT_IDFor instance, you could use this command to find out the names of all systemd units the system has ever run:
journalctl -F _SYSTEMD_UNIT
Logs made simple
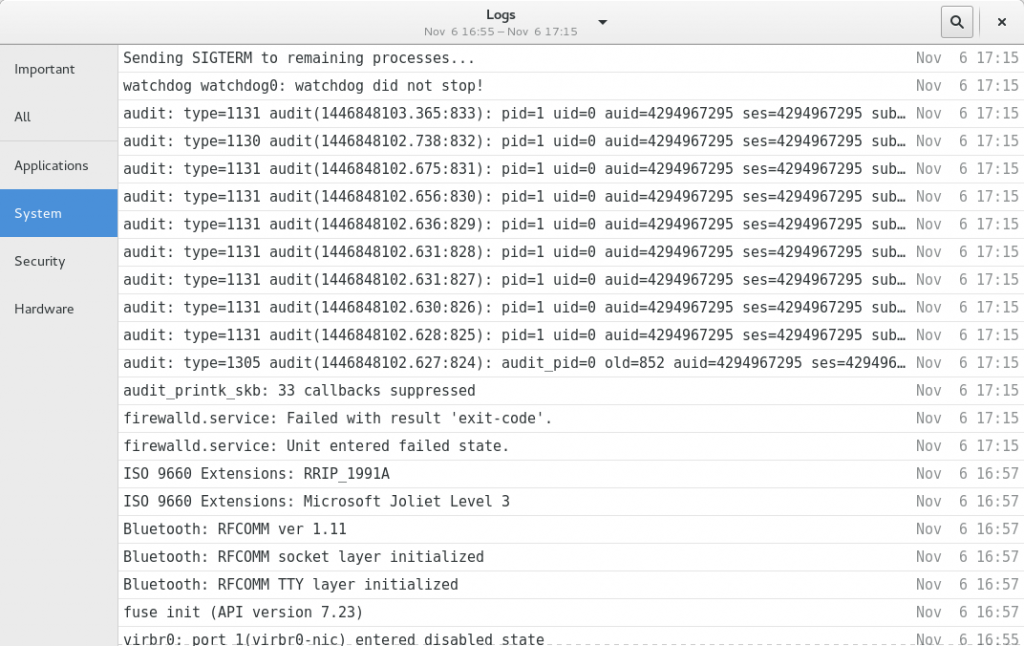
Perhaps you’re not interested in using the journal through a terminal. Fortunately, there’s a useful application called Logs you can get for your Fedora Workstation, or other edition. Install it via the Software application. It gives you an easy, point and click interface for looking at systemd log messges.You may have seen this application earlier. In fact, we reported about it in Fedora Magazine in this post for Fedora 21. You’ll be happy to know it is now lightning-fast, and loads messages on demand.

The log messages are separated by what generated the message. To choose a different category, click it on the left side of the app. You can also choose a specific boot session to examine logs. Click on the date and time header control to select the session you prefer. You can also search for specific issues using the search tool. Finally, to display details on any log message, click the message in the list.
Hopefully this article has shown you some useful and interesting ways to use the journal. For additional helpful information, refer to this blog entry in the original “systemd for administrators” series. Happy logging!

No comments:
Post a Comment