https://www.2daygeek.com/atop-system-process-performance-monitoring-tool/2
Atop is an
ASCII full-screen system performance monitoring tool for Linux that is
capable of reporting the activity of all server processes (even if
processes have finished during the interval).
It’s logging of system and process activity for long-term analysis (By default, the log files are preserved for 28 days), highlighting overloaded system resources by using colors, etc. It shows network activity per process/thread with combination of the optional kernel module netatop.
atop is a Linux process monitor tool which is similar to top but provides major advantages compared to other performance monitoring tools such as top, etc.
It shows system resources activity such as CPU utilization, memory utilization, swap utilization, disks (including LVM), disk I/O, network utilization, priority, username, state and exit code for every process (and thread).
[For openSUSE Leap 42.1]

show individual threads : atop with help of

Memory Utilization information : atop with help of
Disk Utilization information : atop with help of

atop with help of
atop with help of

atop with help of
atop with help of

Alternatively you can sort processes in order of high consumption.
Check the network usage, atop with help of
It’s logging of system and process activity for long-term analysis (By default, the log files are preserved for 28 days), highlighting overloaded system resources by using colors, etc. It shows network activity per process/thread with combination of the optional kernel module netatop.
atop is a Linux process monitor tool which is similar to top but provides major advantages compared to other performance monitoring tools such as top, etc.
It shows system resources activity such as CPU utilization, memory utilization, swap utilization, disks (including LVM), disk I/O, network utilization, priority, username, state and exit code for every process (and thread).
Atop Advantages
- Resource consumption by all processes
- Utilization of all relevant resources
- Permanent logging of resource utilization
- Highlight critical resources
- Scalable window width
- Resource consumption by individual threads
- Watch activity only & Watch deviations only
- Accumulated process activity per user
- Accumulated process activity per program
- Network activity per process
1) Install atop on Linux
atop package is not available on RHEL/CentOS system official repository, so we need to Install/Enable EPEL Repository to get the package installed. For other distribution we can get it from official distribution repository.[For RHEL/CentOS & upto Fedora 21] $ sudo yum install atop [Fedora 22 and later] $ sudo dnf install atop [For Debian/Ubuntu/Mint] $ sudo apt install atop [Arch Linux Based System] $ sudo pacman -S atop [Mageia] $ sudo urpmi atop
1a) Install atop on openSUSE
atop package is not available on openSUSE system official repository, so we need to add additional repository.[For openSUSE Leap 42.1]
$ sudo zypper addrepo http://download.opensuse.org/repositories/server:monitoring/openSUSE_Leap_42.1/server:monitoring.repo
$ sudo zypper refresh
$ sudo zypper install atop
[For openSUSE 13.2]
$ sudo zypper addrepo http://download.opensuse.org/repositories/server:monitoring/openSUSE_13.2/server:monitoring.repo
$ sudo zypper refresh
$ sudo zypper install atop
[For openSUSE Leap 13.1]
$ sudo zypper addrepo http://download.opensuse.org/repositories/server:monitoring/openSUSE_13.1/server:monitoring.repo
$ sudo zypper refresh
$ sudo zypper install atop
2) Adjust Atop configuration
By default atop store the activity on every 10 mins interval, if you want to log the activity on every 1 min for critical production server, you can do by modifying the interval value from600 to 60 on atop config file.[Debian based systems] $ sudo nano /etc/default/atop [RPM based systems] $ sudo nano /etc/sysconfig/atop [Arch Linux based systems] $ sudo nano /etc/atop/atop.daily INTERVAL=60
Note Logs are located @ /var/log/atop/ and you can check the history when you want.3) Atop Usage
After successful installation, just typeatop to monitor the Linux process activity, which will update every 10 seconds. The output is similar to top, see below.$ atop

show individual threads : atop with help of
-y flag shows individual users activity, like root, etc.,.$ atop -y

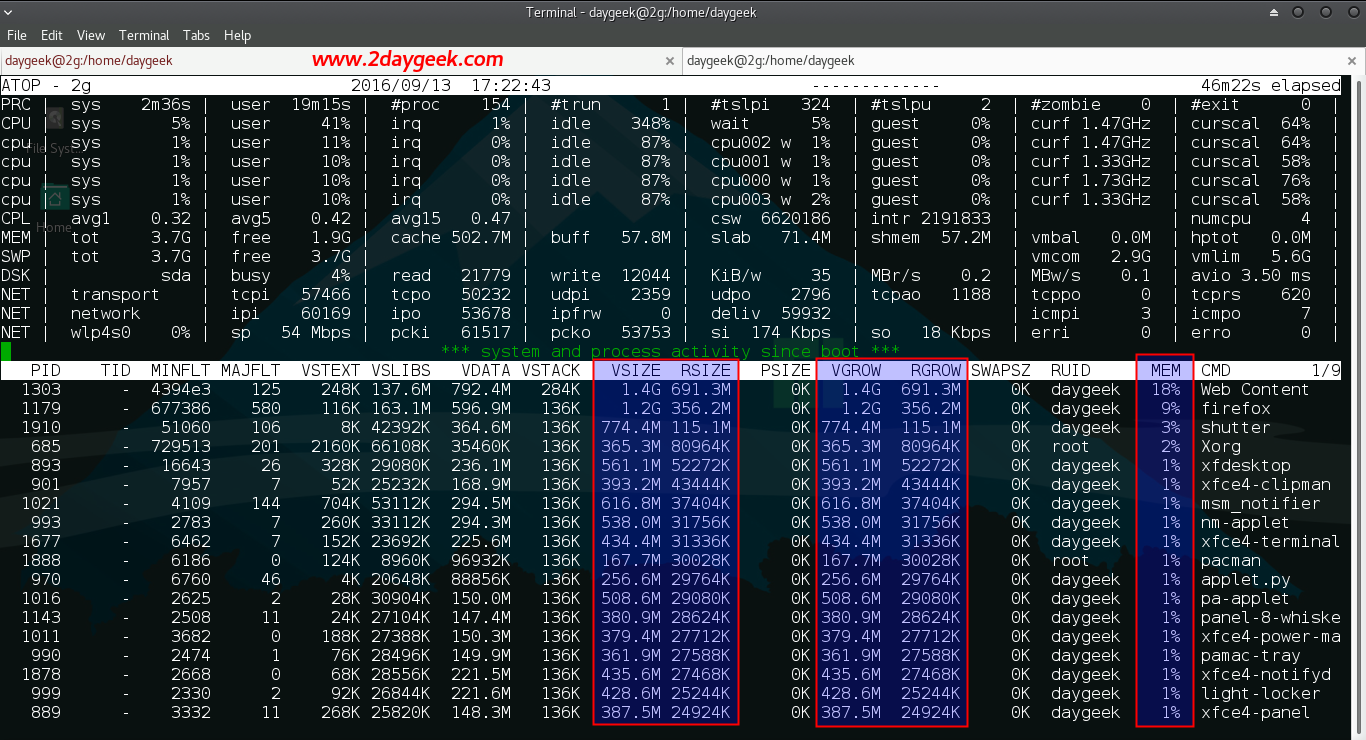
-m flag shows running process memory information such as VSIZE, RSIZE, VGROW, RGROW & MEM.VSIZEShows total virtual memory usage per processRSIZEShows total resident memory usage per processVGROWShows virtual memory growth during the last intervalRGROWShows resident virtual memory during the last intervalMEMShows actual memory usage percentage
$ atop -m

Disk Utilization information : atop with help of
-d flag
shows disks activity information. RDDSK shows amount of data read &
WRDSK shows amount of date write. DSK shows amout of Read & Write
for the process.$ atop -d

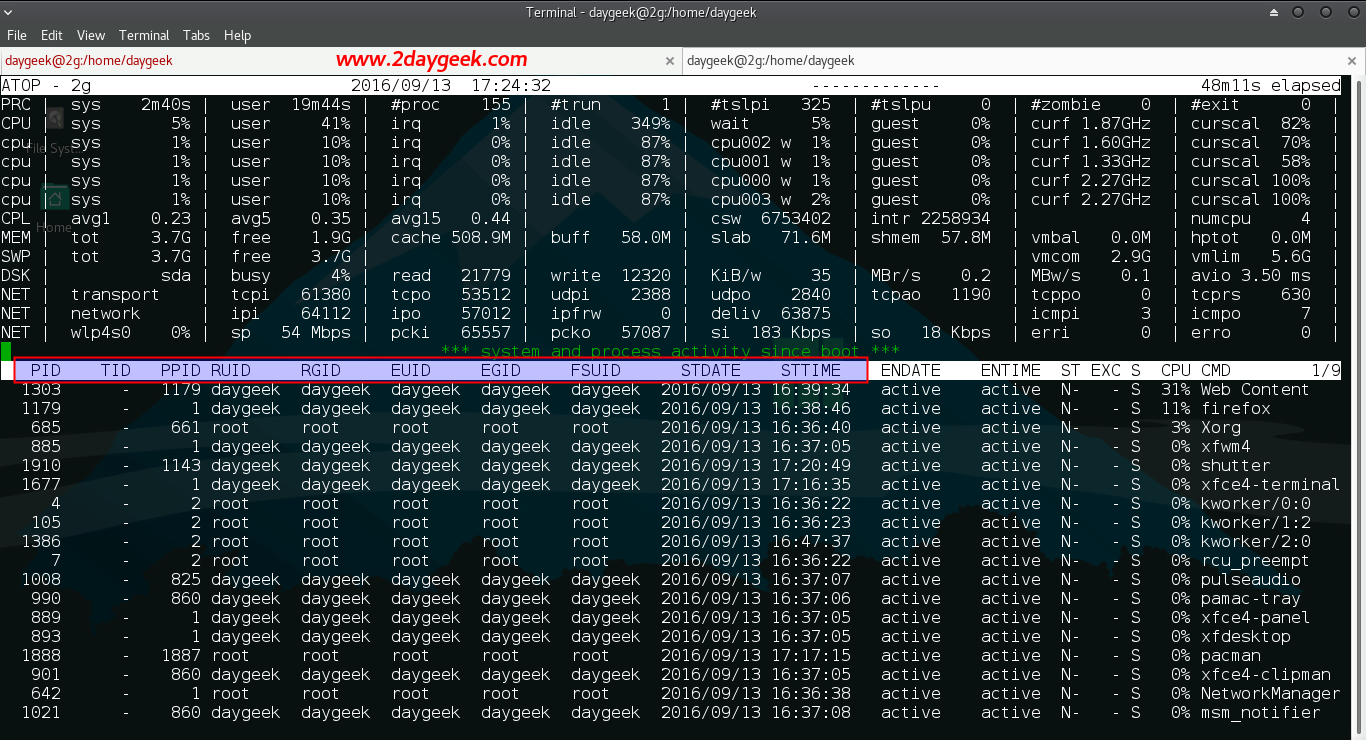
atop with help of
-v flag shows various process
information such as pid (Process Identifier), ppid (Parent Process
Identifier), RUID (User Identifier), RGID (Group Identifier), date &
time.$ atop -v

atop with help of
-c flag shows detailed command for each process.$ atop -c

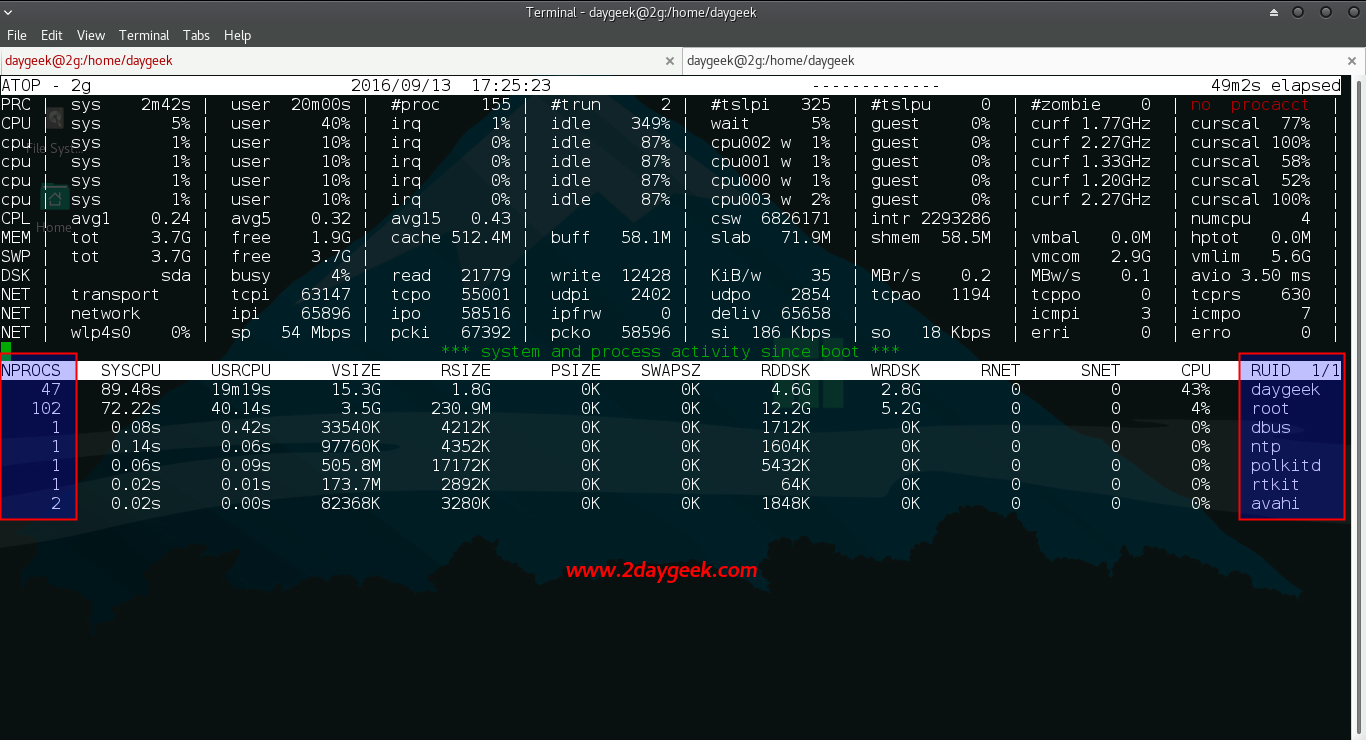
-u flag shows, how many process (process count) are active for each user.$ atop -u

atop with help of
-p flag shows, show cumulated process-info per program.$ atop -p

Alternatively you can sort processes in order of high consumption.
CSort processes in order of cpu-consumption (default)MSort processes in order of memory-consumptionDSort processes in order of disk-activityNSort processes in order of network-activityASort processes in order of most active resource (auto mode)
4) Install & configure netatop on Linux
There is no official package for netatop and we have to compile manually on Linux. Install required dependency packages kernel-devel, zlib-devel & zlib1g-dev to make it work netatop.[For RHEL/CentOS & upto Fedora 21] $ sudo yum install kernel-devel zlib-devel [Fedora 22 and later] $ sudo dnf install kernel-devel zlib-devel [For Debian/Ubuntu/Mint] $ sudo apt install zlib1g-devVisit the netatop page and download the latest release and follow the below procedure.
$ wget http://www.atoptool.nl/download/netatop-1.0.tar.gz
$ tar -xvf netatop-1.0.tar.gz
$ cd netatop-1.0
$ sudo make
$ sudo make install
Load the module and start the daemon.
[For SysVinit system]
$ sudo service netatop start

[For systemd system]
$ sudo systemctl start netatop.service
Load the module and start the daemon on boot.
[For RPM based SysVinit system]
$ sudo chkconfig --add netatop

[For Debian based SysVinit system]
$ sudo update-rc.d netatop defaults

[For systemd system]
$ sudo systemctl enable netatop.service
-n flag. Translate
No comments:
Post a Comment