https://www.2daygeek.com/install-dstat-resource-statistics-process-performance-monitoring-tool-on-linux
Dstat
– versatile tool for generating system resource statistics &
replacement for vmstat, iostat, netstat and ifstat. Dstat is another
handy tool for monitoring systems during performance tuning tests,
benchmarks or troubleshooting. It overcomes some of other tools
limitations and adds some extra features, more counters and flexibility.
I really impressed by dstat utility when analyzing the tool to prepare the article. I excited then i dig into deep on dstat utility usage, wow! awesome features which i didn’t find any performance monitoring tools.
You can monitor additionally MySQL database activity, batter percentage info for laptop, number of dbus connections, fan speed, nfs utility, postfix, system temperature sensors, power usage, etc,., more & more. I personally advise every administrator to give a try, which will help you to improve the troubleshooting skill a lot.
Dstat allows you to view all of your system resources in real-time. You can add any combination on dstat command with option as per your requirements. Eg. compare bandwidth utilization with particular Ethernet (eth0 or eth1).
Dstat gives you detailed information about given input in columns, so Less confusion, less mistakes. You can export details to CSV output to a file for further investigation and graph generation.
By default dstat output display, delay in seconds between each update. Lot’s of predefined Plugins are available to generate the unmatched report, also you can write your own plugins to collect your own counters and extend in ways you never expected.

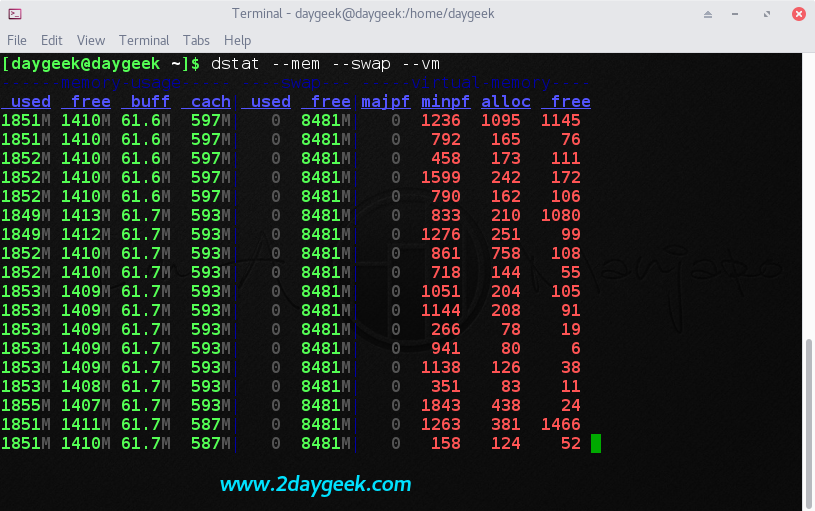
To show detailed information about Memory, Included (used, buffer, cache & free), Swap (used & free) & Virtual Memory (allocated, free, major page fault & minor page fault) usage.
To show detailed information about each CPU (include cpu0, cpu1, etc) & total usage. It display each CPU (user time, system time, idle time, steal time & wait time) process activity

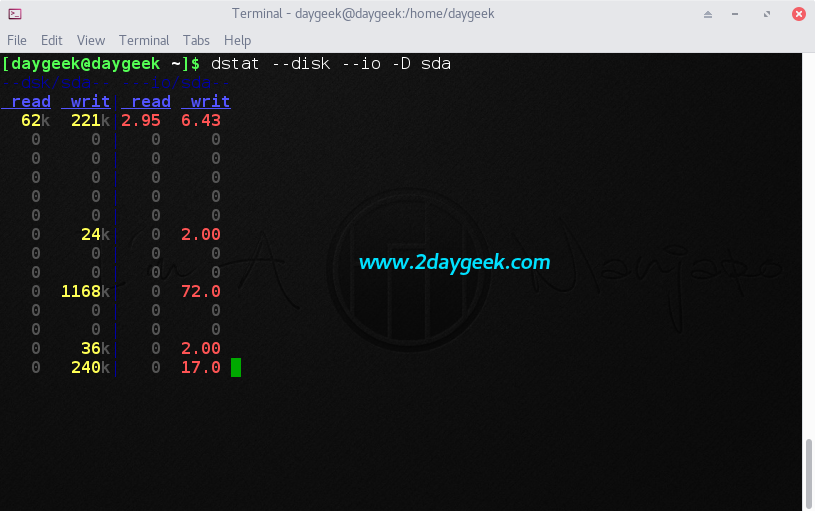
To show detailed information about disk utilization (read &
write) & disk I/O (read & write) utilization for particular
disk. If you want to check total disk utilization & I/O, use
To show detailed information about network utilization (data receive & data send) for particular Ethernet. If you want to show all the Ethernet utilization, use

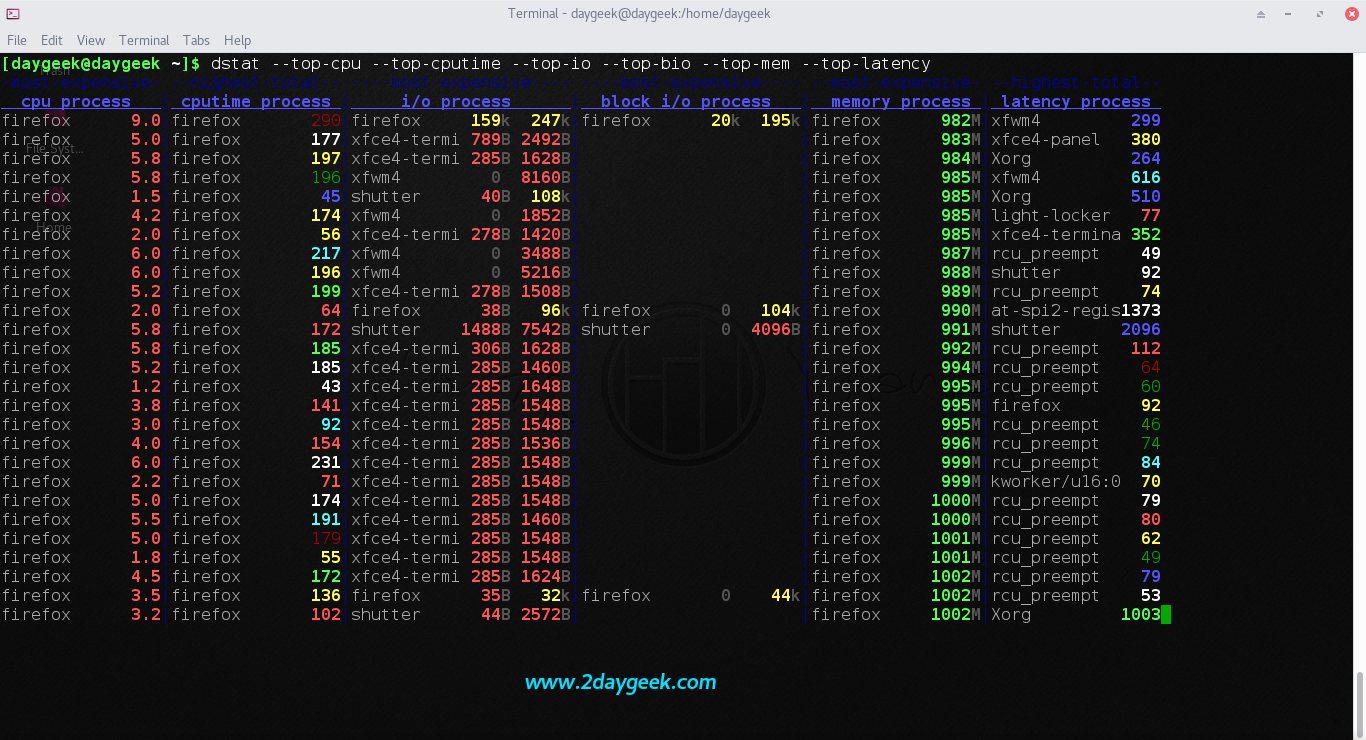
To show detailed information about top cpu, top cputime (process using the most CPU time (in ms)), top disk I/O activity, top disk block I/O activity, top memory and top latency usage.
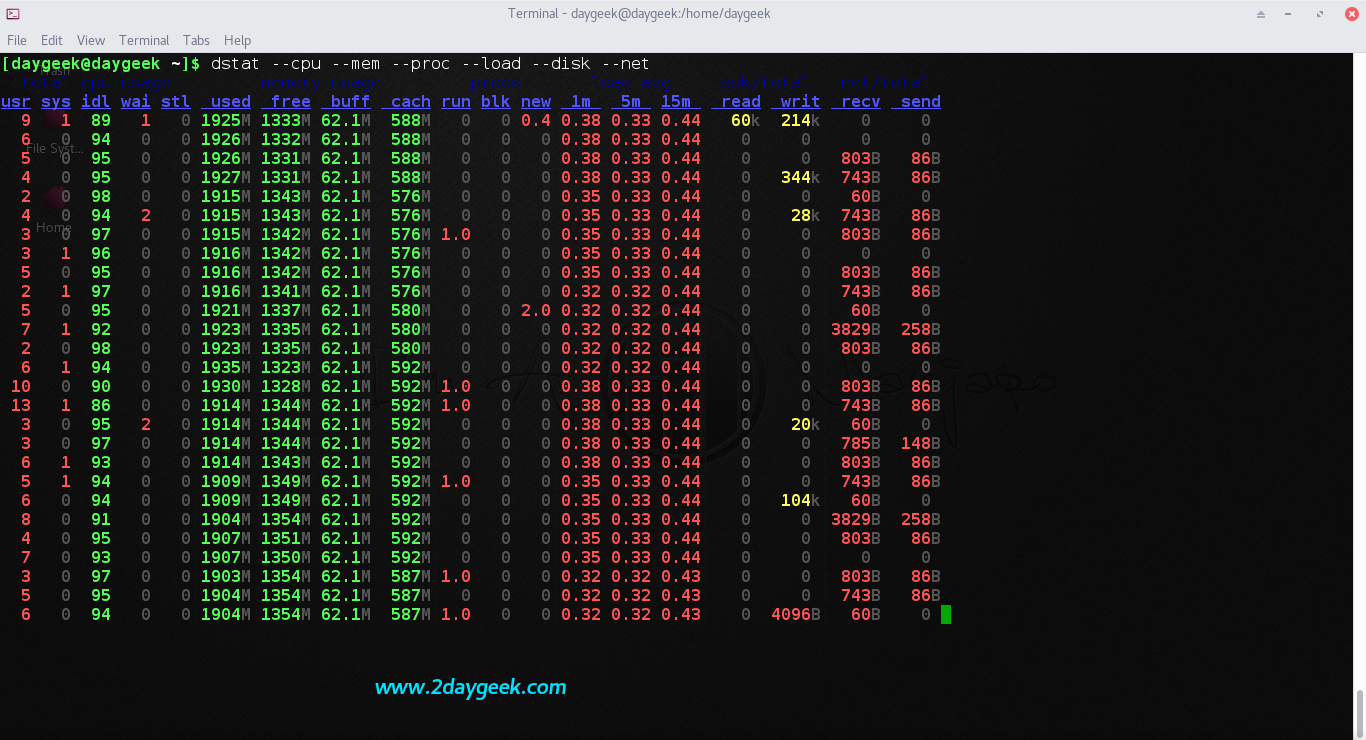
To show detailed information about (CPU, Disk, Memory, Process, Load
& network) usage, which is very common for basic troubleshooting
when server load is too high.
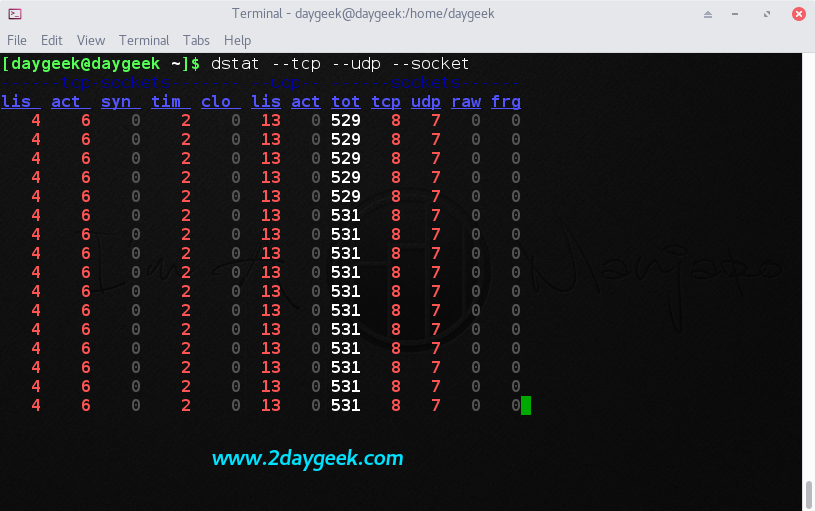
To show detailed information about tcp (listen, established, syn, time_wait, close), udp (listen, active) & socket (total, tcp, udp, raw, ip-fragments) usage.
Display statistic every 5 seconds delay instead of default (1 sec delay) with any combination as per your requirement. The below combination shows about cpu & process statistic every 5 seconds

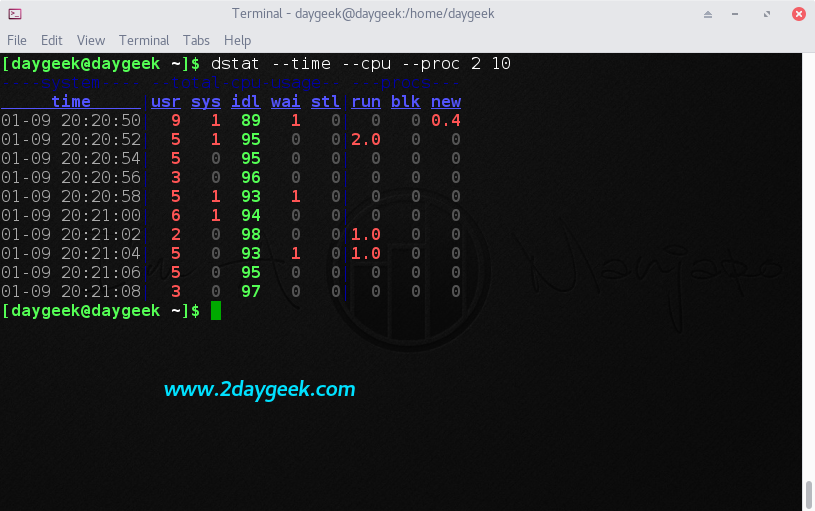
By default delay is 1 sec and count is UNLIMITED, if you want to display statistic every 2 seconds delay with 10 counts on any combination as per your requirement. The below combination shows about cpu & process statistic every 2 seconds with 10 counts.
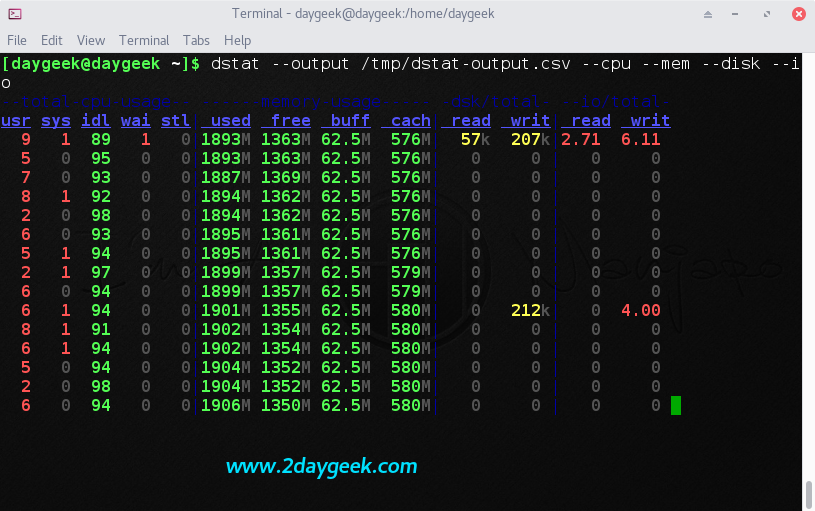
If you want to store the reports to file for further investigation, you can do by using the below format with any combination.
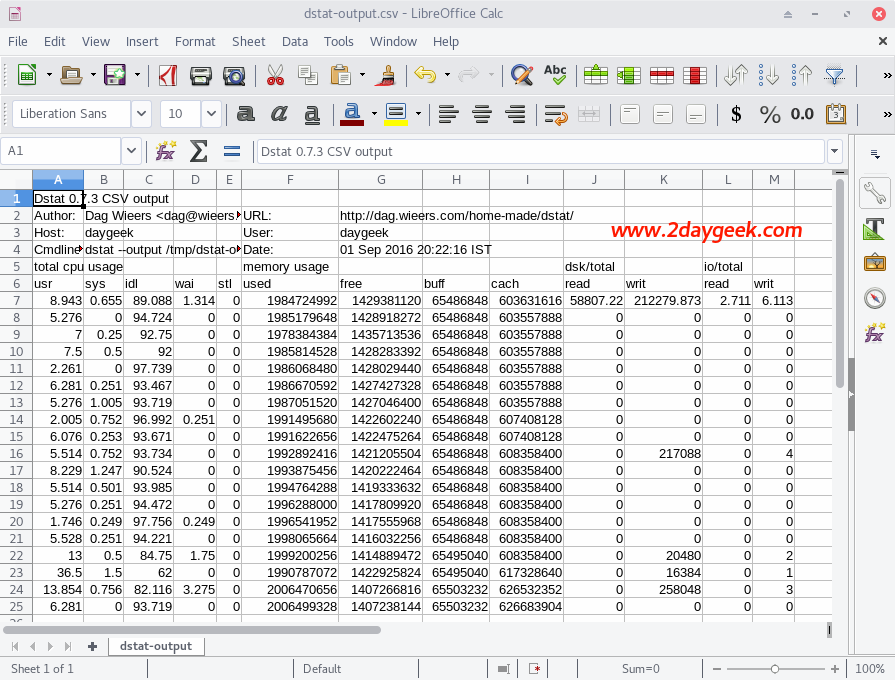
See the output.csv file date.
I really impressed by dstat utility when analyzing the tool to prepare the article. I excited then i dig into deep on dstat utility usage, wow! awesome features which i didn’t find any performance monitoring tools.
You can monitor additionally MySQL database activity, batter percentage info for laptop, number of dbus connections, fan speed, nfs utility, postfix, system temperature sensors, power usage, etc,., more & more. I personally advise every administrator to give a try, which will help you to improve the troubleshooting skill a lot.
Dstat allows you to view all of your system resources in real-time. You can add any combination on dstat command with option as per your requirements. Eg. compare bandwidth utilization with particular Ethernet (eth0 or eth1).
Dstat gives you detailed information about given input in columns, so Less confusion, less mistakes. You can export details to CSV output to a file for further investigation and graph generation.
By default dstat output display, delay in seconds between each update. Lot’s of predefined Plugins are available to generate the unmatched report, also you can write your own plugins to collect your own counters and extend in ways you never expected.
Dstat Features
- Combines vmstat, iostat, ifstat, netstat information and more
- Shows stats in exactly the same timeframe
- Enable/order counters as they make most sense during analysis/troubleshooting
- Modular design
- Written in python so easily extendable for the task at hand
- Easy to extend, add your own counters (please contribute those)
- Includes many external plugins to show how easy it is to add counters
- Can summarize grouped block/network devices and give total numbers
- Can show interrupts per device
- Very accurate timeframes, no timeshifts when system is stressed
- Shows exact units and limits conversion mistakes
- Indicate different units with different colors
- Show intermediate results when delay > 1
- Allows to export CSV output, which can be imported in Gnumeric and Excel to make graphs
1) Install dstat on Linux
dstat package is not available on RHEL/CentOS system official repository, so we need to Install/Enable EPEL Repository to get the package installed. For other distribution we can get it from official distribution repository.[For RHEL/CentOS & upto Fedora 21] $ sudo yum install dstat [Fedora 22 and later] $ sudo dnf install dstat [For Debian/Ubuntu/Mint] $ sudo apt install dstat [Arch Linux Based System] $ sudo pacman -S dstat [openSUSE/SUSE] $ sudo zypper in dstat [Mageia] $ sudo urpmi dstat
2) dstat Usage
After successful installation of dstat, simply fire dstat without any option, you will get similar to below screen.$ dstatThe below output, combination of
cdngy- c : cpu : Total cpu usage
- d : disk : Disk Utilization
- n : net : Total Network usage
- g : page : page stats
- y : sys : system stats

To show detailed information about Memory, Included (used, buffer, cache & free), Swap (used & free) & Virtual Memory (allocated, free, major page fault & minor page fault) usage.
$ dstat --mem --swap --vm

To show detailed information about each CPU (include cpu0, cpu1, etc) & total usage. It display each CPU (user time, system time, idle time, steal time & wait time) process activity
$ dstat -C 0,1,2,total

dstat --disk --io.$ dstat --disk --io -D sda

To show detailed information about network utilization (data receive & data send) for particular Ethernet. If you want to show all the Ethernet utilization, use
dstat --net.$ dstat --net -N eth1

To show detailed information about top cpu, top cputime (process using the most CPU time (in ms)), top disk I/O activity, top disk block I/O activity, top memory and top latency usage.
$ dstat --top-cpu --top-cputime --top-io --top-bio --top-mem --top-latency

$ dstat --cpu --mem --proc --load --disk --net

To show detailed information about tcp (listen, established, syn, time_wait, close), udp (listen, active) & socket (total, tcp, udp, raw, ip-fragments) usage.
$ dstat --tcp --udp --socket

Display statistic every 5 seconds delay instead of default (1 sec delay) with any combination as per your requirement. The below combination shows about cpu & process statistic every 5 seconds
$ dstat --time --cpu --proc 5

By default delay is 1 sec and count is UNLIMITED, if you want to display statistic every 2 seconds delay with 10 counts on any combination as per your requirement. The below combination shows about cpu & process statistic every 2 seconds with 10 counts.
$ dstat --time --cpu --proc 2 10

If you want to store the reports to file for further investigation, you can do by using the below format with any combination.
$ dstat --output /opt/dstat-output.csv --cpu --mem --disk --io


No comments:
Post a Comment