Want to do a quick performance check on your Linux system? You might want to take a look at the dstat
command. Dstat provides valuable insights into Linux system
performance, pretty much replacing a collection of older tools such as
vmstat, netstat, iostat, and ifstat with a flexible and powerful command
that combines their features.
With this one command, you can look
at virtual memory, network connections and interfaces, CPU activity,
input/output devices and more. In today's post, we'll examine some dstat
commands and see what they can show you about your systems.
Dstat options and defaults
First, let's start with a fairly simple command. With the dstat -c (CPU) option, dstat displays CPU stats. In the example below, we're asking for two-second intervals and six reports.
Note that the first line of data in this report, which
looks very different than the others, gives you the averages since the
system was last booted and is returned immediately regardless of the
specified interval. In this example, we see that the system on average
has been largely idle (96%), but is now quite busy working between user
and system processing tasks.
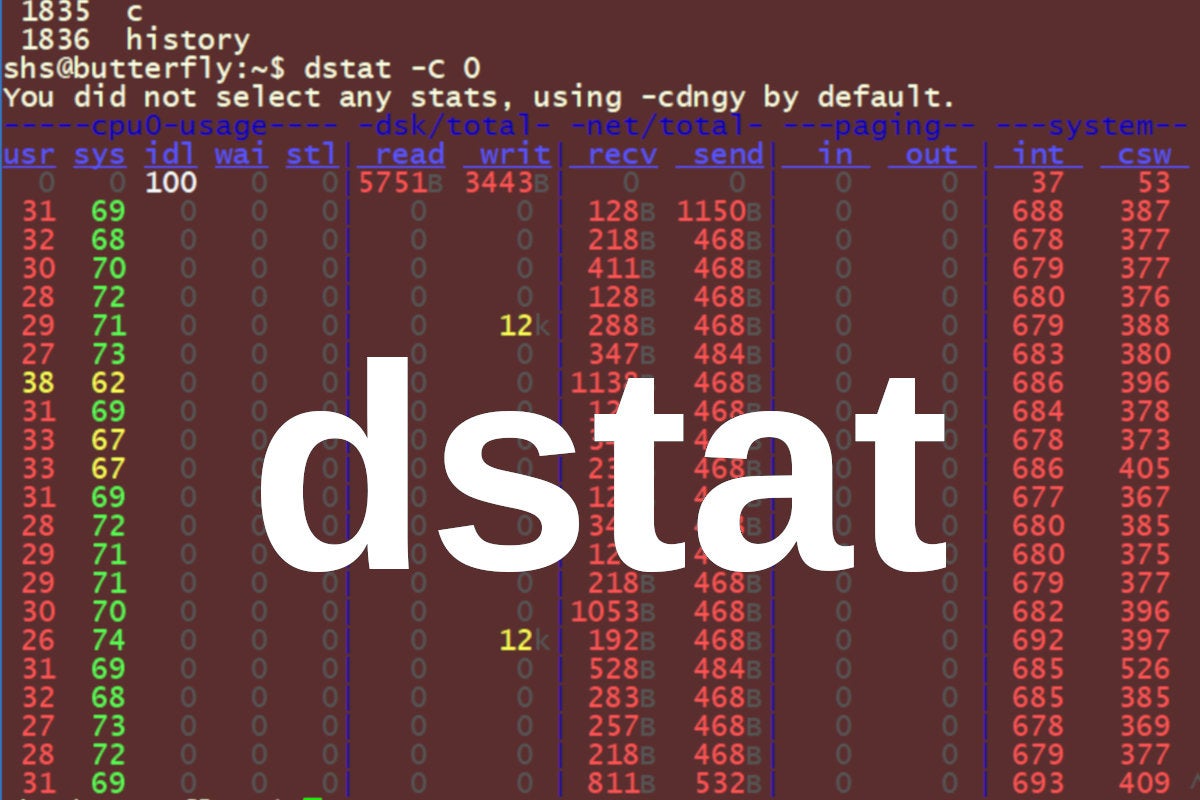
If you don't supply any options with dstat, the command will use a default set (-cdngy) set of options. These include:
c -- cpu
d -- disk
n -- network
g -- paging stats
y -- system stats
The output of this command will look something like what you see below.
You probably noticed the "You did not select any stats" message
near the top of the output displayed above. To overcome this with
little effort, simply add the -a option. It will select the default options and omit the warning message.
In this "no options" approach, you can still set the timing for
each interval in seconds and the number of intervals you want to see
reported. If you don't specify the number of intervals, the command will
continue running until you stop it with a ^c.
What does this tell you?
In
the output shown above, we saw evidence that the system being queried
was fairly busy. No idle time was being reported; the CPU was spending
all of its time between user and system tasks. Compare this with report,
which shows the system is idle half the time.
The disks, on the other hand, are not busy at all with zero reads and writes.
One
key to becoming adept at evaluating system performance is to run
commands like these periodically — even when you don't see the need to
question how well a system is running. If you come to know what normal
performance looks like for a server, you will have a much easier time
spotting problems.
Here's another example, this one with some disk activity:
In all these samples, we're not seeing any paging (loading
executable images into a process's virtual memory) activity. There is a
fairly constant amount of interrupts and context switching going on, but
the numbers are all quite modest.
In the command below, we're
looking at a memory usage report. Notice the amount of free memory
compared to the memory in use. This system is not being challenged.
In this last example, we're generating the standard report, but
adding one thing. We're also writing the report to a .csv file so that
it can be used in other tools such as Excel.
As mentioned, dstat is a great tool for
looking at just about all aspects of system performance. But another
answer to this question is that it's a Python script and one you're free
to peruse if you'd like to see how it works.
$ which dstat
/usr/bin/dstat
$ file /usr/bin/dstat
/usr/bin/dstat: Python script, ASCII text executable
$ more /usr/bin/dstat | head -6
#!/usr/bin/env python2

### This program is free software; you can redistribute it and/or
### modify it under the terms of the GNU General Public License
### as published by the Free Software Foundation; either version 2
### of the License, or (at your option) any later version.
Join the Network World communities on Facebook and LinkedIn to comment on topics that are top of mind.


![Network World - Insider asset - Invaluable Tips + Tricks for Troubleshooting Linux [Winter 2018]](https://images.idgesg.net/images/article/2017/12/2017_11_nw_linuxtips-100744213-small.3x2.jpg)

No comments:
Post a Comment