http://xmodulo.com/2014/04/transparent-https-filtering-proxy-centos.html
HTTPS protocol is used more and more in today’s web. While this may
be good for privacy, it leaves modern network administrator without any
means to prevent questionable or adult contents from entering his/her
network. Previously it was assumed that this problem does not have a
decent solution. Our how-to guide will try to prove otherwise.
This guide will tell you how to set up Squid on CentOS / RedHat Linux for transparent filtering of HTTP and HTTPS traffic with help of Diladele Web Safety ICAP server, which is a commercial solution for Linux, BSD and MacOS. The Linux installer of Diladele Web Safety used in this tutorial contains fully featured keys which remain valid for 3 month period, so you can test its full features during this trial period.
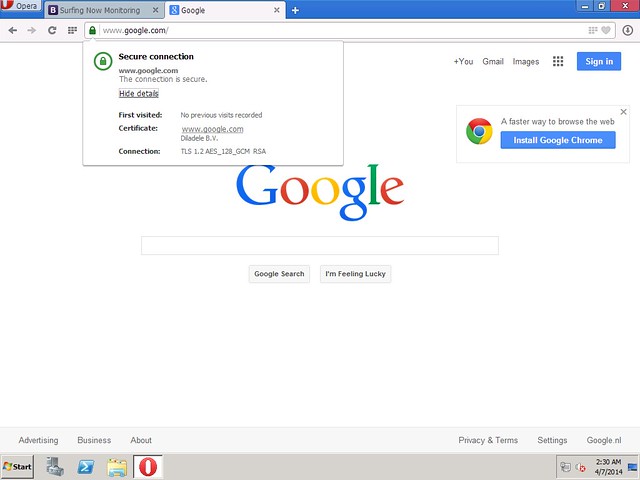
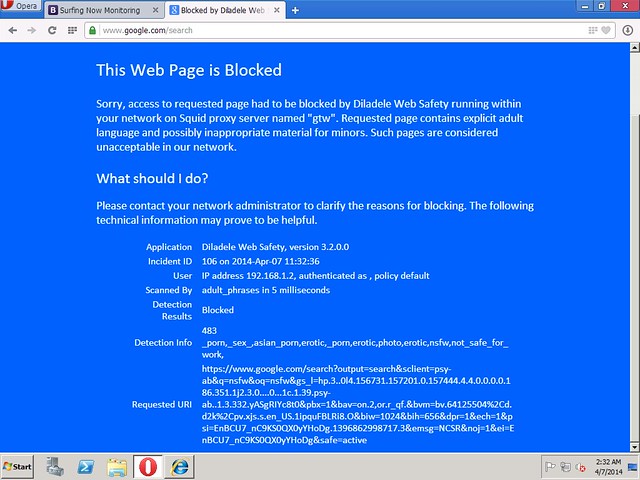
Browsing to Google and searching for an adult term (e.g. NSFW), we get the HTTPS request filtered and blocked transparently.
This guide will tell you how to set up Squid on CentOS / RedHat Linux for transparent filtering of HTTP and HTTPS traffic with help of Diladele Web Safety ICAP server, which is a commercial solution for Linux, BSD and MacOS. The Linux installer of Diladele Web Safety used in this tutorial contains fully featured keys which remain valid for 3 month period, so you can test its full features during this trial period.
Assumptions and Requirements
In this tutorial, I will assume the following. You have a network with IP addresses from 192.168.1.0 subnet, network mask is 255.255.255.0, and all workstations are set to use 192.168.1.1 as default gateway. On this default gateway, you have two NICs - one facing LAN with IP address 192.168.1.1, the other is plugged in into ISP network and gets its public Internet address through DHCP. It is also assumed your gateway has CentOS or RedHat Linux up and running.Step 1. Update and Upgrade
Before going further, run the following script to upgrade your system to the most recent state.
1
2
3
4
5
6
7
8
9
10
11
12
13
14
15
16
17
| #!/bin/bashset -e# update should be done as rootif [[ $EUID -ne 0 ]]; then echo "This script must be run as root" 1>&2 exit 1fi# update and upgradeyum update && yum upgrade # disable selinuxsed -i s/SELINUX=enforcing/SELINUX=disabled/g /etc/selinux/config# and rebootreboot |
Step 2. Install Apache Web Server
Diladele Web Safety has sophisticated a web administrator console to easily manage filtering settings and policies. This Web UI is built using Python Django web framework, and requires Apache web server to function correctly. Run the following script to install them.
1
2
3
4
5
6
7
8
9
10
11
12
13
14
15
16
17
18
19
20
21
22
23
24
25
26
| #!/bin/bashset -e# all web packages are installed as rootif [[ $EUID -ne 0 ]]; then echo "This script must be run as root" 1>&2 exit 1fi# install python libsyum install python-setuptools python-ldap# install python django for web uieasy_install django==1.5# install apache web server to run web uiyum install httpd php mod_wsgi# make apache autostart on rebootchkconfig httpd on# this fixes some apache errors when working with python-django wsgiecho "WSGISocketPrefix /var/run/wsgi" >> /etc/httpd/conf.d/wsgi.conf# and restart apacheservice httpd restart |
Step 3. Install Diladele Web Safety
Download and install the latest version of Diladele Web Safety using the following script.
1
2
3
4
5
6
7
8
9
10
11
12
13
14
15
16
17
18
19
20
21
22
23
24
25
26
27
| #!/bin/bash# all packages are installed as rootif [[ $EUID -ne 0 ]]; then echo "This script must be run as root" 1>&2 exit 1fi# detect current architecture (default assumes x86_64)ARCH_1=`uname -m`ARCH_2="amd64"if [[ $ARCH_1 == 'i686' ]]; then ARCH_1="i386" ARCH_2="i386"fi# bail out on any errorset -e# get latest qlproxycurl http://updates.diladele.com/qlproxy/binaries/3.2.0.4CAF/$ARCH_2/release/centos6/qlproxy-3.2.0-4CAF.$ARCH_1.rpm > qlproxy-3.2.0-4CAF.$ARCH_1.rpm# install ityum -y --nogpgcheck localinstall qlproxy-3.2.0-4CAF.$ARCH_1.rpm # qlproxy installed everything needed for apache, so just restartservice httpd restart |
Step 4. Install Required Build Tools
To be able to perform HTTP/HTTPS transparent filtering, we need to get the latest version of Squid (the one that comes with CentOS / RedHat by default is too outdated), and rebuild it from source. The following script installs all build tools required.
1
2
3
4
5
6
7
8
9
10
11
12
13
14
15
| #!/bin/bash# install all build toolsif [[ $EUID -ne 0 ]]; then echo "This script must be run as root" 1>&2 exit 1fi# install development packages requiredyum install -y gcc-c++
pam-devel db4-devel expat-devel libxml2-devel libcap-devel libtool
redhat-rpm-config rpm-build openldap-devel openssl-devel krb5-devel# squid needs perl and needs additional perl modules not present by default in CentOS 6curl http://dl.fedoraproject.org/pub/epel/6/x86_64/epel-release-6-8.noarch.rpm > epel-release-6-8.noarch.rpmrpm -Uvh epel-release-6*.rpmyum install -y perl-Crypt-OpenSSL-X509 |
Step 5. Build Squid from Source
Rebuild the Squid RPM by running the following script.
1
2
3
4
5
6
7
8
9
10
11
12
13
14
15
16
17
18
19
20
21
| #!/bin/bash# stop on any errorset -e# rpm build MUST be run as normal userif [[ $EUID -eq 0 ]]; then echo "This script must NOT be run as root" 1>&2 exit 1fi# get squid sourcespushd rpmbuild/SOURCEScurl http://www.squid-cache.org/Versions/v3/3.4/squid-3.4.4.tar.xz > squid-3.4.4.tar.xzcurl http://www.squid-cache.org/Versions/v3/3.4/squid-3.4.4.tar.xz.asc > squid-3.4.4.tar.xz.ascpopd# build the binaries RPMs out of sourcespushd rpmbuild/SPECSrpmbuild -v -bb squid.specpopd |
Step 6. Install Squid
After build finishes, install Squid. It is advisable to uncomment the lines which generate your own root certification authority. Default installation of Diladele Web Safety does have its own ca, but trusting it may pose serious security risk if your devices are used by users outside of your network.
1
2
3
4
5
6
7
8
9
10
11
12
13
14
15
16
17
18
19
20
21
22
23
24
25
26
27
28
29
30
31
32
33
34
35
36
37
38
39
40
41
42
43
| #!/bin/bash# stop on every errorset -e# install RPMs as rootif [[ $EUID -ne 0 ]]; then echo "This script must be run as root" 1>&2 exit 1fi# detect current architecture (default assumes x86_64)ARCH_1=`uname -m`ARCH_2="amd64"ARCH_3="lib64"if [[ $ARCH_1 == 'i686' ]]; then ARCH_2="i386" ARCH_3="lib"fipushd rpmbuild/RPMS/$ARCH_1yum localinstall -y squid-3.4.4-0.el6.$ARCH_1.rpmpopd# set up the ssl_crtd daemonif [ -f /bin/ssl_crtd ]; then rm -f /bin/ssl_crtdfiln -s /usr/$ARCH_3/squid/ssl_crtd /bin/ssl_crtd/bin/ssl_crtd -c -s /var/spool/squid_ssldbchown -R squid:squid /var/spool/squid_ssldb# uncomment to regenerate certificates for SSL bumping if you do not like defaults# openssl req -new -newkey rsa:1024 -days 1365 -nodes -x509 -keyout myca.pem -out myca.pem# openssl x509 -in myca.pem -outform DER -out myca.der# then copy certificates # cp myca.pem /etc/opt/quintolabs/qlproxy/# cp myca.der /etc/opt/quintolabs/qlproxy/# make squid autostart after rebootchkconfig squid on |
Step 7. Integrate Squid with Diladele Web Safety
Integrate Squid and Diladele Web Safety by running the following script.
1
2
3
4
5
6
7
8
9
10
11
12
13
14
15
16
17
18
19
20
21
22
| #!/bin/bash# stop on any errorset -e# integration should be done as rootif [[ $EUID -ne 0 ]]; then echo "This script must be run as root" 1>&2 exit 1fi# allow web ui read-only access to squid configuration filechmod o+r /etc/squid/squid.conf# perform integration by replacing squid.conf filemv /etc/squid/squid.conf /etc/squid/squid.conf.original && mv squid.conf /etc/squid/squid.conf# parse the resulting config just to be sure/usr/sbin/squid -k parse# restart squid to load all config/sbin/service squid restart |
Step 8. Transparently Redirect HTTPS Traffic to Squid
Transparent filter for HTTP and HTTPS traffic will be implemented by redirecting traffic to ports 80 and 443 to Squid using iptables. This implies that the box with Squid acts as default gateway for your LAN. Please note this is only one way to implementing transparent filtering. Other possible solutions are described in Squid’s Wiki.
1
2
3
4
5
6
7
8
9
10
11
12
13
14
15
16
17
18
19
20
21
22
23
24
25
26
27
28
29
30
31
32
33
34
35
36
37
38
39
40
41
42
43
44
45
46
47
48
49
50
51
52
53
54
55
56
57
58
59
60
61
62
63
64
65
66
67
68
69
70
71
72
73
74
| #!/bin/bash# firewall setup should be done as rootif [[ $EUID -ne 0 ]]; then echo "This script must be run as root" 1>&2 exit 1fi# check kernel forwarding is enabledenabled=`cat /proc/sys/net/ipv4/ip_forward`if [[ $enabled -ne 1 ]]; then echo "Kernel forwarding seems to be disabled, enable it in /etc/sysctl.conf, reboot and rerun this script" 1>&2 exit 1fi# set the default policy to accept first (not to lock ourselves out from remote machine)iptables -P INPUT ACCEPT# flush all current rules from iptablesiptables -F# allow pings from eth0 and eth1 for debugging purposesiptables -A INPUT -p icmp -j ACCEPT# allow access for localhostiptables -A INPUT -i lo -j ACCEPT# accept packets belonging to established and related connectionsiptables -A INPUT -m state --state ESTABLISHED,RELATED -j ACCEPT# allow ssh connections to tcp port 22 from eth0 and eth1iptables -A INPUT -p tcp --dport 22 -j ACCEPT# allow connection from LAN to ports 3126, 3127 and 3128 squid is running oniptables -A INPUT -i eth0 -p tcp --dport 3126 -j ACCEPTiptables -A INPUT -i eth0 -p tcp --dport 3127 -j ACCEPTiptables -A INPUT -i eth0 -p tcp --dport 3128 -j ACCEPT# redirect all HTTP(tcp:80) traffic coming in through eth0 to 3126iptables -t nat -A PREROUTING -i eth0 -p tcp -m tcp --dport 80 -j REDIRECT --to-ports 3126# redirect all HTTPS(tcp:443) traffic coming in through eth0 to 3127iptables -t nat -A PREROUTING -i eth0 -p tcp -m tcp --dport 443 -j REDIRECT --to-ports 3127# configure forwarding rulesiptables -A FORWARD -i eth0 -o eth1 -p tcp --dport 22 -j ACCEPTiptables -A FORWARD -i eth1 -o eth0 -p tcp --sport 22 -j ACCEPTiptables -A FORWARD -p icmp -j ACCEPTiptables -A FORWARD -i eth0 -o eth1 -p tcp --dport 80 -j ACCEPTiptables -A FORWARD -i eth1 -o eth0 -p tcp --sport 80 -j ACCEPTiptables -A FORWARD -i eth0 -o eth1 -p tcp --dport 53 -j ACCEPTiptables -A FORWARD -i eth0 -o eth1 -p udp --dport 53 -j ACCEPTiptables -A FORWARD -m state --state ESTABLISHED,RELATED -j ACCEPTiptables -A FORWARD -j REJECT --reject-with icmp-host-prohibited# enable NAT for clients within LANiptables -t nat -A POSTROUTING -o eth1 -j MASQUERADE# set default policies for INPUT, FORWARD (drop) and OUTPUT (accept) chainsiptables -P INPUT DROPiptables -P FORWARD DROPiptables -P OUTPUT ACCEPT# list created rulesiptables -L -v# save the rules so that after reboot they are automatically restored/sbin/service iptables save# enable the firewallchkconfig iptables on# and reboot machinereboot |
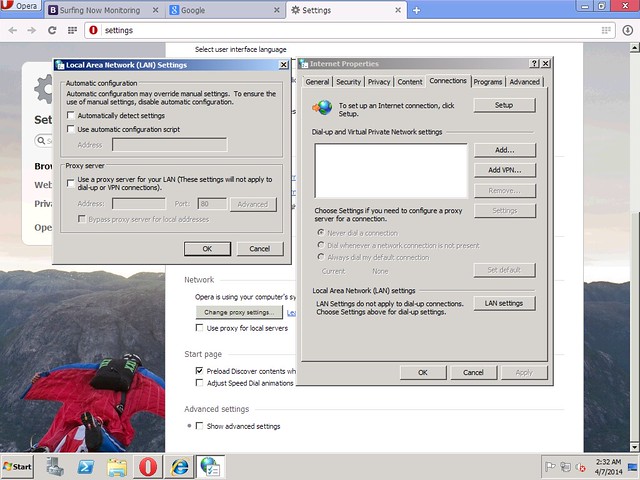
Check if HTTPS is Transparently Filtered
Please note, in order for HTTPS filtering to function correctly, we must install the proxy certificate from /etc/opt/quintolabs/qlproxy/myca.der into Trusted Root Certification on all workstations in our network. The following screenshots show that HTTPS requests were decrypted and filtered transparently.Browsing to Google and searching for an adult term (e.g. NSFW), we get the HTTPS request filtered and blocked transparently.