Thursday, June 26, 2014

How to configure a Tomcat cluster on Ubuntu

http://xmodulo.com/2014/06/configure-tomcat-cluster-ubuntu.html

Apache Tomcat is the most popular open-source Java web server. If your web site is expecting more traffic as your business grows, a single instance of Tomcat will probably not scale with the growing traffic. In that case, you might be thinking to run Tomcat in a "clustered" environment, where web server workload is distributed to multiple Tomcat instances.
In this article I will show you how to configure a Tomcat cluster with load balancing and session replication. Before we delve into the details about the setup, we want to clarify some of the terms we will be using in this tutorial.

Terminology

Load balancing: When HTTP requests are received by a front-end server (often called "load balancer", "proxy balancer" or "reverse proxy"), the front-end server distributes the requests to more than one "worker" web servers in the backend, which actually handle the requests. Load balancing can get rid of a single point of failure in the backend, and can achieve high availability, scalability and better resource optimization for any web service.
Session replication: Session replication is a mechanism to copy the entire state of a client session verbatim to two or more server instances in a cluster for fault tolerance and failover. Typically, stateful services that are distributed are capable of replicating client session states across different server instances in a cluster.
Cluster: A cluster is made up of two or more web server instances that work in unison to transparently serve client requests. Clients will perceive a group of server instances as a single entity service. The goal of the cluster is to provide a highly available service for clients, while utilizing all available compute resources as efficiently as possible.

Requirements

Here are the requirements for setting up a Tomcat cluster. In this tutorial, I assume there are three Ubuntu servers.
  • Server #1: Apache HTTP web server with mod_jk (for proxy balancer)
  • Server #2 and #3: Java runtime 6.x or higher and Apache Tomcat 7.x (for worker web server)
Apache web server is acting as a proxy balancer. Apache web server is the only server visible to clients, and all Tomcat instances are hidden from clients. With mod_jk extension activated, Apache web server will forward any incoming HTTP request to Tomcat worker instances in the cluster.
In the rest of the tutorial, I will describe step by step procedure for configuring a Tomcat cluster.

Step One: Install Apache Web Server with mod_jk Extension

Tomcat Connectors allows you to connect Tomcat to other open-source web servers. For Apache web server, Tomcat Connectors is available as an Apache module called mod_jk. Apache web server with mod_jk turns a Ubuntu server into a proxy balancer. To install Apache web server and mod_jk module, use the following command.
$ sudo apt-get install apache2 libapache2-mod-jk

Step Two: Install JDK and Apache Tomcat

The next step is to install Apache Tomcat on the other two Ubuntu servers which will actually handle HTTP requests as workers. Since Apache Tomcat requires JDK, you need to install it as well. Follow this guide to install JDK and Apache Tomcat on Ubuntu servers.

Step Three: Configure Apache mod_jk on Proxy Balancer

On Ubuntu, the mod_jk configuration file is located in /etc/apache2/mods-enabled/jk.conf. Update this file with the following content:
1
2
3
4
5
6
7
8
9
10
11
12
13
14
15
16
17
18
19
20
21
22
23
24
25
26
27
28
29
30
31
32
33
34
35
36
37
38
39
40
41
    # We need a workers file exactly once
    # and in the global server
    JkWorkersFile /etc/libapache2-mod-jk/workers.properties
    # JK error log
    # You can (and should) use rotatelogs here
    JkLogFile /var/log/apache2/mod_jk.log
    # JK log level (trace,debug,info,warn,error)
    JkLogLevel info
    JkShmFile /var/log/apache2/jk-runtime-status
    JkWatchdogInterval 60
    JkMount /*  loadbalancer
    JkMount /jk-status jkstatus
    # Configure access to jk-status and jk-manager
    # If you want to make this available in a virtual host,
    # either move this block into the virtual host
    # or copy it logically there by including "JkMountCopy On"
    # in the virtual host.
    # Add an appropriate authentication method here!
    /jk-status>
            # Inside Location we can omit the URL in JkMount
            JkMount jk-status
            Order deny,allow
            Deny from all
            Allow from 127.0.0.1
    </Location>
    /jk-manager>
            # Inside Location we can omit the URL in JkMount
            JkMount jk-manager
            Order deny,allow
            Deny from all
            Allow from 127.0.0.1
    </Location>
</IfModule>
In order to make the above configuration work with multiple Tomcat instances, we have to configure every Tomcat worker instance in /etc/libapache2-mod-jk/workers.properties. We assume that the IP addresses of the two worker Ubuntu machines are 192.168.1.100 and 192.168.1.200.
Create or edit etc/libapache2-mod-jk/workers.properties with the following content:
1
2
3
4
5
6
7
8
9
10
11
12
13
14
15
16
17
18
19
20
21
22
23
24
25
26
27
28
29
30
31
32
worker.list=loadbalancer,jkstatus
# Configure Tomcat instance for 192.168.1.100
worker.tomcat1.type=ajp13
worker.tomcat1.host=192.168.1.100
worker.tomcat1.port=8081
# worker "tomcat1" uses up to 200 sockets, which will stay no more than
# 10 minutes in the connection pool.
worker.tomcat1.connection_pool_size=200
worker.tomcat1.connection_pool_timeout=600
# worker "tomcat1" will ask the operating system to send a KEEP-ALIVE
# signal on the connection.
worker.tomcat1.socket_keepalive=1
# Configure Tomcat instance for 192.168.1.200
worker.tomcat2.type=ajp13
worker.tomcat2.host=192.168.1.200
worker.tomcat2.port=8082
# worker "tomcat2" uses up to 200 sockets, which will stay no more than
# 10 minutes in the connection pool.
worker.tomcat2.connection_pool_size=200
worker.tomcat2.connection_pool_timeout=600
# worker "tomcat2" will ask the operating system to send a KEEP-ALIVE
# signal on the connection.
worker.tomcat2.socket_keepalive=1
worker.jkstatus.type=status
worker.loadbalancer.type=lb
worker.loadbalancer.balance_workers=tomcat1,tomcat2

Step Four: Configure Tomcat Instances

Edit /opt/apache-tomcat-7.0.30/conf/server.xml for Tomcat instance on 192.168.1.100 with the following content:
1
2
3
4
5
6
7
8
9
10
11
12
13
14
15
16
17
18
19
    "Catalina" defaultHost="192.168.1.100” jvmRoute="tomcat1">
    "org.apache.catalina.ha.tcp.SimpleTcpCluster" channelSendOptions="8">
    "org.apache.catalina.ha.session.DeltaManager"
        expireSessionsOnShutdown="false"
        notifyListenersOnReplication="true"/>
    "org.apache.catalina.tribes.group.GroupChannel">
        "org.apache.catalina.tribes.transport.ReplicationTransmitter">
            "org.apache.catalina.tribes.transport.nio.PooledParallelSender"/>
        </Sender>
        "org.apache.catalina.tribes.transport.nio.NioReceiver" address="auto"        port="4000" autoBind="100" selectorTimeout="5000" maxThreads="50"/>
    "org.apache.catalina.tribes.group.interceptors.TcpFailureDetector"/>
    "org.apache.catalina.tribes.group.interceptors.MessageDispatch15Interceptor"/>
    </Channel>
    "org.apache.catalina.ha.tcp.ReplicationValve" filter=""/>
    "org.apache.catalina.ha.session.JvmRouteBinderValve"/>
    "org.apache.catalina.ha.session.JvmRouteSessionIDBinderListener"/>
    "org.apache.catalina.ha.session.ClusterSessionListener"/>
</Cluster>
Edit /opt/apache-tomcat-7.0.30/conf/server.xml for Tomcat instance on 192.168.1.200 with the following content:
1
2
3
4
5
6
7
8
9
10
11
12
13
14
15
16
17
18
19
    "Catalina" defaultHost="192.168.1.200” jvmRoute="tomcat2">
    "org.apache.catalina.ha.tcp.SimpleTcpCluster" channelSendOptions="8">
    "org.apache.catalina.ha.session.DeltaManager"
        expireSessionsOnShutdown="false"
        notifyListenersOnReplication="true"/>
    "org.apache.catalina.tribes.group.GroupChannel">
        "org.apache.catalina.tribes.transport.ReplicationTransmitter">
            "org.apache.catalina.tribes.transport.nio.PooledParallelSender"/>
        </Sender>
     
        "org.apache.catalina.tribes.transport.nio.NioReceiver" address="auto"        port="4000" autoBind="100" selectorTimeout="5000" maxThreads="30"/>
    "org.apache.catalina.tribes.group.interceptors.TcpFailureDetector"/>
    "org.apache.catalina.tribes.group.interceptors.MessageDispatch15Interceptor"/>
    </Channel>
    "org.apache.catalina.ha.tcp.ReplicationValve" filter=""/>
    "org.apache.catalina.ha.session.JvmRouteBinderValve"/>
    "org.apache.catalina.ha.session.JvmRouteSessionIDBinderListener"/>
    "org.apache.catalina.ha.session.ClusterSessionListener"/>
</Cluster>

Step Five: Test a Tomcat Cluster

Tomcat Connectors has a special type of worker, the so-called status worker. The status worker does not forward requests to Tomcat instances. Instead, it allows one to retrieve status and configuration information at run-time, and even to change many configuration options dynamically. You can monitor the Tomcat cluster by accessing this status worker, which can be done simply by going to http:///jk-status on a web browser.

Using pass to Manage Your Passwords on Fedora

http://fedoramagazine.org/using-pass-to-manage-your-passwords-on-fedora

At this point, I have more usernames and passwords to juggle than any person should ever have to deal with. I know I’m not alone, either. We have a surfeit of passwords to manage, and we need a good way to manage them so we have easy access without doing something silly like writing them down where others might find them. Being a fan of simple apps, I prefer using pass, a command line password manager.
It’s never been a good idea to use the same username and password with multiple services, but in today’s world? It’s potentially disasterous. So I don’t. At the moment, I’m juggling something like 90 to 100 passwords for all of the services I use. Multiple Twitter accounts, my server credentials, OpenShift applications, my FAS credentials, sign-in for Rdio, and lots more.
As you might imagine, trying to memorize all of those passwords is an exercise in futility. I remember my system password, and a handful of others. Beyond that? I’d rather save some of my brain’s limited storage for more important things.

What’s pass, and What’s it Require?

So what is pass? It’s basically a simple command-line utility that helps you manage passwords. It uses GnuPG-encrypted files to save and manage user passwords. It will even keep them in a git repository, if you choose to set it up that way. That means you’ll need the pass package installed, along with its dependencies like git, gnupg2, and pwgen (a utility for generating passwords).
Yes, there are other options, but I settled on pass a while back as the best fit for my needs. Here’s how you can give it a shot and see if it works for you!

Installation and Setup

Installing pass is simple, it’s conveniently packaged for Fedora. Just open a terminal and run yum install -y pass and it should grab all the dependencies you need.
The first thing you need to do is create a GPG Key. See the Fedora wiki for detailed instructions, or just use gpg --gen-key and walk through the series of prompts. When in doubt, accept the defaults.
Now, you just need to initialize your password store with pass init GPG-ID. Replace “GPG-ID” with the email address you used for your GPG key.

Using pass: Adding and Creating Passwords

Now that you have a password store set up, it’s time to start creating or inserting passwords. If you already have a password you want to store, use pass edit passwordname. For example, if you were going to store your Fedora Account System (FAS) password, you might use pass edit FAS/user with “user” being your username in FAS.
This will create a directory (FAS) and the file (user) in Git, and encrypt the file so that no one can read it without your GPG passphrase. If you look under ~/.password-store/FAS/ you’ll see a file like user.gpg. The directory part is optional, but I find it useful to help keep track of passwords.
If you want to create a new password, just use pass generate FAS/user 12 where “FAS/user” would be the username, and the password length (generated by pwgen) would be 12 characters. The auto-generated passwords will include upper- and lower-case letters, numbers, and special characters.

Creating a git Repository

One of the biggest selling points to me for pass is its integration with git. But it’s not automatic, you do need to tell it to initialize the git repo and use it. First, make sure you’ve set your git globals:

git config --global user.email "your@email.com" 
git config --global user.name "Awesome User"

Then run pass git init and it will intialize a git repository in your password store. From then on, it will automatically add new passwords and such to the git repo. If you want to manage passwords on multiple machines, this makes it dead easy: Just clone the repository elsewhere and keep them in sync as you would a normal git repo.

Using pass: Reading Passwords

To recall a password, all you need to do is run pass user, so pass FAS/user would print out the password to the terminal. But what if you don’t want it to be seen by someone looking over your shoulder?
Here’s a nifty workaround for that, just use pass -c FAS/user and it will simply copy your password to the clipboard for 45 seconds. All you have to do is run the command, move over to the application where you’d like to enter your password, and then hit Enter.
If you’ve forgotten what passwords you have stored with pass, just use pass ls and you’ll get a complete listing.

Deleting Passwords

Sometimes you need to get rid of a password. Just use pass rm user and pass will ask if you’re sure, then delete the password file.
If you delete something by accident, you can simply go back and revert the commit!

Stay Safe!

So that’s the basics of using pass. You can get even more examples by running man pass, and I highly recommend skimming the man page at least once.
I have been using pass for some time now, and it’s been a life-saver. I hope it serves you as well as it has me!

Wednesday, June 25, 2014

Top 3 open source business intelligence and reporting tools

http://opensource.com/business/14/6/three-open-source-business-tools

This article reviews three top open source business intelligence and reporting tools. In economies of big data and open data, who do we turn to in order to have our data analysed and presented in a precise and readable format? This list covers those types of tools. The list is not exhaustive—I have selected tools that are widely used and can also meet enterprise requirements. And, this list is not meant to be a comparison—this is a review of what is available.

BIRT

BIRT is part of the open source Eclipse project and was first released in 2004. BIRT is sponsored by Actuate, and recieves contributions from IBM and Innovent Solutions.
BIRT consists of several components. The main components being the Report Designer and BIRT Runtime. BIRT also provides three extra components: a Chart Engine, Chart Designer, and Viewer. With these components you are able to develop and publish reports as a standalone solution. However, with the use of the Design Engine API, which you can include in any Java/Java EE application, you can add reporting features in your own applications. For a full description and overview of it’s architecture, see this overview.
The BIRT Report Designer has a rich feature set, is robust, and performs well. It scores high in terms of usability with it’s intuitive user interface. An important difference with the other tools is the fact it presents reports primarily to web. It lacks a true Report Server, but by using the Viewer on a Java application server, you can provide end users with a web interface to render and view reports.
If you are looking for support, you can either check out the BIRT community or the Developer Center at Actuate. The project also provides extensive documentation and a Wiki.
BIRT is licensed under the Eclipse Public License. It’s latest release 4.3.2, which runs on Windows, Linux and Mac, can be downloaded here. Current development is shared through it’s most recent project plan.

JasperReport

TIBCO recently acquired JasperSoft, the company formerly behind JasperReport. JasperReport is the most popular and widely used open source reporting tool. It is used in hundreds of thousands production environments. JasperReport is released as Enterprise and Community editions.
Similar to BIRT, JasperReport consists of several components such as the JasperReport Library, iReport Report Designer, JasperReport Studio, and JasperReport Server. The Library is a library of Java classes and APIs and is the core of JasperReport. iReport Designer and Studio as the report designers where iReport is a Netbeans plugin and standalone client, and Studio an Eclipse plugin. Note: iReport will be discontinued in December 2015, with Studio becoming the main designer component. For a full overview and description of the components, visit the homepage of the JasperReport community.
A full feature list of JasperSoft (Studio) can be viewed here. Different from BIRT, JasperReport is using a pixel-perfect approach in viewing and printing it’s reports. The ETL, OLAP, and Server components provide JasperReport with valuable functionality in enterprise environments, making it easier to integrate with the IT-architecture of organisations.
JasperReport is supported by excellent documentation, a Wiki, Q&A forums, and user groups. Based on Java, JasperReport runs on Windows, Linux, and Mac. It’s latest release 5.5 is from October 2013, and is licensed under GPL.

Pentaho

Unlike the previous two tools, Pentaho is a complete business intelligene (BI) Suite, covering the gamut from reporting to data mining. The Pentaho BI Suite encompasses several open source projects, of which Pentaho Reporting is one of them.
Like the other tools, Pentaho Reporting has a rich feature set, ready for use in enterprise organisations. From visual report editor to web platform to render and view reports to end users. And report formats like PDF, HTML and more, security and role management, and the ability to email reports to users.
The Pentaho BI suite also contains the Pentaho BI Server. This is a J2EE application which provides an infrastructure to run and view reports through a web-based user interface. Other components from the suite are out of scope for this article. They can be viewed on the site from Pentaho, under the Projects menu. Pentaho is released as Enterprise and Community editions.
The Pentaho project provides it’s community with a forum, Jira bug tracker, and some other collaboration options. It’s documentation can be found on a Wiki.
Pentaho runs on Java Enterprise Edition and can be used on Windows, Linux, and Mac. It’s latest release is version 5.0.7 from May 2014, and is licensed under GPL.

Summary

All three of these open source business intelligence and reporting tools provide a rich feature set ready for enterprise use. It will be up to the end user to do a thorough comparison and select either of these tools. Major differences can be found in report presentations, with a focus on web or print, or in the availability of a report server. Pentaho distinguishes itself by being more than just a reporting tool, with a full suite of components (data mining and integration).
Have you used any of these tools? What was your experience? Or, have you used similar tool not listed here that you would like to share?

How to sync Microsoft OneDrive on Linux

http://xmodulo.com/2014/06/sync-microsoft-onedrive-linux.html

OneDrive (previously known as SkyDrive) is a popular cloud storage offering from Microsoft. Currently OneDrive offers 7GB free storage for every new signup. As you can imagine, OneDrive is well integrated with other Microsoft software products. Microsoft also offers a standalone OneDrive client which automatically backs up pictures and videos taken by a camera to OneDrive storage. But guess what. This client is available for all major PC/mobile platforms except Linux. "OneDrive on any device, any time"? Well, it is not there, yet.
Don't get disappointed. The open-source community already has already come up with a solution for you. onedrive-d written by a Boilermaker in Lafayette can get the job done. Running as a monitoring daemon, onedrive-d can automatic sync a local folder with OneDrive cloud storage.
In this tutorial, I will describe how to sync Microsoft OneDrive on Linux by using onedrive-d.

Install onedrive-d on Linux

While onedrive-d was originally developed for Ubuntu/Debian, it now supports CentOS/Fedora/RHEL as well.
Installation is as easy as typing the following.
$ git clone https://github.com/xybu92/onedrive-d.git
$ cd onedrive-d
$ ./inst install

First-Time Configuration

After installation, you need to go through one-time configuration which involves granting onedrive-d read/write access to your OneDrive account.
First, create a local folder which will be used to sync against a remote OneDrive account.
$ mkdir ~/onedrive
Then run the following command to start the first-time configuration.
$ onedrive-d
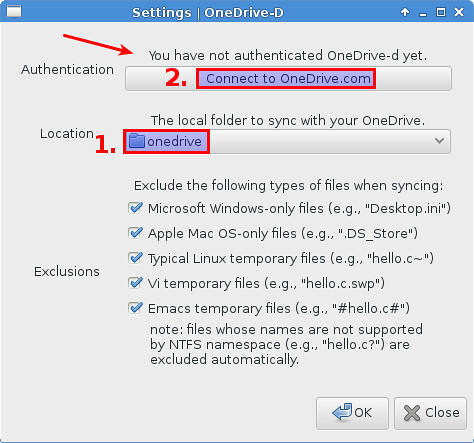
It will pop up a onedrive-d's Settings window as shown below. In "Location" option, choose the local folder you created earlier. In "Authentication" option, you will see "You have not authenticated OneDrive-d yet" message. Now click on "Connect to OneDrive.com" box.

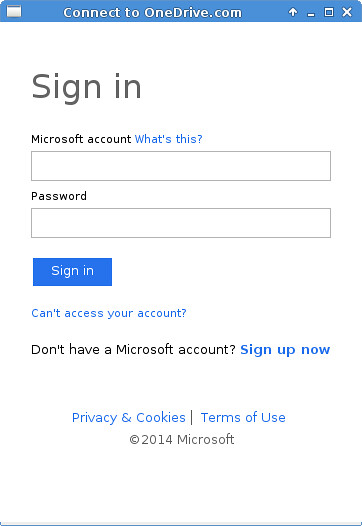
It will pop up a new window asking you to sign in to OneDrive.com.

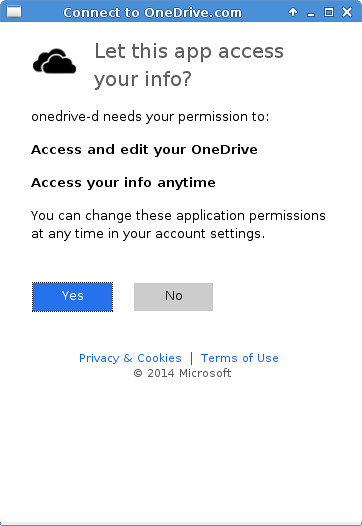
After logging in to OneDrive.com, you will be asked to grant access to onedrive-d. Choose "Yes".

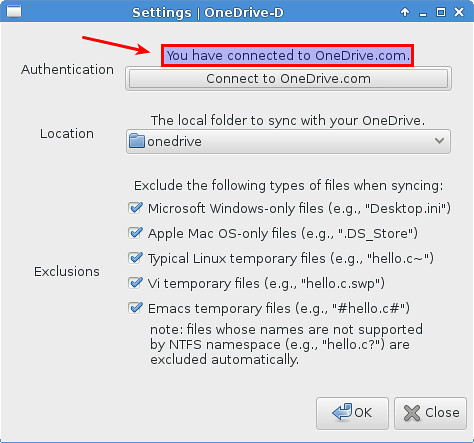
Coming back to the Settings window, you will see that the previous status has changed to "You have connected to OneDrive.com". Click on "OK" to finish.

Sync a Local Folder with OneDrive

There are two ways to sync a local folder with your OneDrive storage by using onedrive-d.
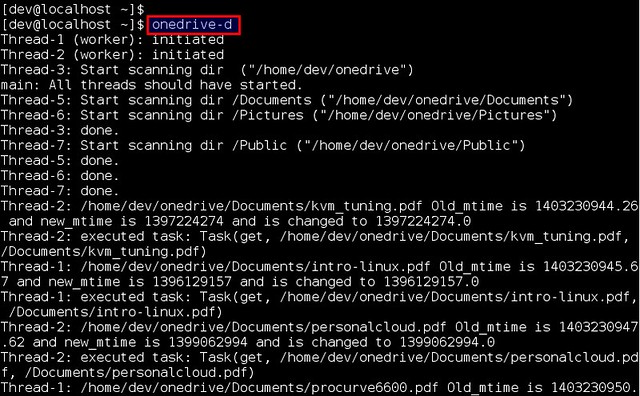
One way is to sync with OneDrive manually from the command line. That is, whenever you want to sync a local folder against your OneDrive account, simply run:
$ onedrive-d
onedrive-d will then scan the content of both a local folder and a OneDrive account, and make the two in sync. This means either uploading newly added files in a local folder, or downloading newly found files from a remote OneDrive account. If you remove any file from a local folder, the corresponding file will automatically be deleted from a OneDrive account after sync. The same thing will happen in the reverse direction as well.
Once sync is completed, you can kill the foreground-running onedrive-d process by pressing Ctrl+C.

Another way is to run onedrive-d as an always-on daemon which launches automatically upon start. In that case, the background daemon will monitor both the local folder and OneDrive account, to keep them in sync. For that, simply add onedrive-d to the auto-start program list of your desktop.
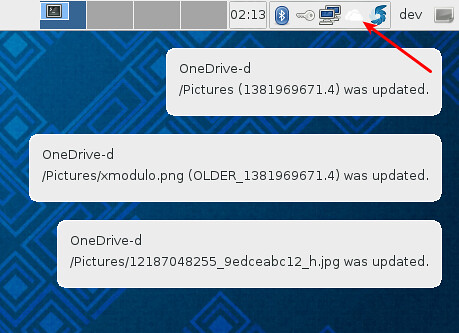
When onedrive-d daemon is running in the background, you will see OneDrive icon in the desktop status bar as shown below. Whenever sync update is triggered, you will see a desktop notification.

A word of caution: According to the author, onedrive-d is still under active development. It is not meant for any kind of production environment. If you encounter any bug, feel free to file a bug report. Your contribution will be appreciated by the author.

LVM Snapshot : Backup & restore LVM Partition in linux

http://www.nextstep4it.com/categories/unix-command/lvm-snapshot

An LVM snapshot is an exact mirror copy of an LVM partition which has all the data from the LVM volume from the time the snapshot was created. The main advantage of LVM snapshots is that they can  reduce the amount of time that your services / application  are down during backups because a snapshot is usually created in fractions of a second. After the snapshot has been created, we can back up the snapshot while our services and applications are in normal operation.

LVM snapshot is the feature provided by LVM(Logical Volume Manager) in linux. While creating lvm snapshot , one of most common question comes to our mind is that what should be the size of snapshot ?

"snapshot size can vary depending on your requirement but a minimum recommended size is 30% of the logical volume for which you are taking the snapshot but if you think that you might end up changing all the data in logical volume then make the snapshot size same as logical volume "

Scenario : We will take snapshot of /home  which  is LVM based parition.

[root@localhost ~]# df -h /home/
Filesystem            Size  Used Avail Use% Mounted on
/dev/mapper/VolGroup-lv_home
                                   5.0G  139M  4.6G   3% /home

Taking Snapshot of   '/dev/mapper/VolGroup-lv_home'  partition.

LVM snapshot is created using lvcreate command , one must have enough free space in the volume group otherwise we can't take the snapshot  , Exact syntax is given below :

# lvcreate -s  -n -L

Example :


[root@localhost ~]# lvcreate -s -n home_snap -L1G /dev/mapper/VolGroup-lv_home
Logical volume "home_snap" created

Now verify the newly create LVM 'home_snap' using lvdisplay command


Now Create the mount point(directory ) and mount it
[root@localhost ~]# mkdir /mnt/home-backup
[root@localhost ~]# mount /dev/mapper/VolGroup-home_snap  /mnt/home-backup/
[root@localhost ~]# ls -l /mnt/home-backup/

Above command will  show all directories and files that we know from our /home partition


Now take the backup of snapshot on /opt folder .

[root@localhost ~]# tar zcpvf /opt/home-backup.tgz  /mnt/home-backup/

If you want the bitwise  backup , then use the below command :

[root@localhost ~]# dd if=/dev/mapper/VolGroup-home_snap of=/opt/bitwise-home-backup
10485760+0 records in
10485760+0 records out
5368709120 bytes (5.4 GB) copied, 79.5741 s, 67.5 MB/s

Restoring Snapshot Backup :

If anything goes wrong with your /home file system , then you can restore the backup that we have taken in above steps.  You can also mount the lvm snapshot on /home folder.

Remove LVM snapshot

Once you are done with lvm snapshot backup and restore activity , you should umount and remove lvm snapshot partition using below commands as snapshot is consuming system resources like diskspace of respective voulme group.

[root@localhost ~]# umount /mnt/home-backup/
[root@localhost ~]# lvremove /dev/mapper/VolGroup-home_snap
Do you really want to remove active logical volume home_snap? [y/n]: y
Logical volume "home_snap" successfully removed

Monday, June 23, 2014

How to speed up directory navigation in a Linux terminal

http://xmodulo.com/2014/06/speed-up-directory-navigation-linux-terminal.html

As useful as navigating through directories from the command line is, rarely anything has become as frustrating as repeating over and over "cd ls cd ls cd ls ..." If you are not a hundred percent sure of the name of the directory you want to go to next, you have to use ls. Then use cd to go where you want to. Hopefully, a lot of terminals and shell languages now propose a powerful auto-completion feature to cope with that problem. But it remains that you have to hit the tabulation key frenetically all the time. If you are as lazy as I am, you will be very interested in autojump. autojump is a command line utility that allows you to jump straight to your favorite directory, regardless of where you currently are.

Install autojump on Linux

To install autojump on Ubuntu or Debian:
$ sudo apt-get install autojump
To install autojump on CentOS or Fedora, use yum command. On CentOS, you need to enable EPEL repository first.
$ sudo yum install autojump
To install autojump on Archlinux:
$ sudo pacman -S autojump
If you cannot find a package for your distribution, you can always compile from the sources on GitHub.

Basic Usage of autojump

The way autojump works is simple: it records your current location every time you launch a command, and adds it in its database. That way, some directories will be added more than others, typically your most important ones, and their "weight" will then be greater.
From there you can jump straight to them using the syntax:
autojump [name or partial name of the directory]
Notice that you do not need a full name as autojump will go through its database and return its most probable result.
For example, assume that we are working in a directory structure such as the following.

Then the command below will take you straight to /root/home/doc regardless of where you were.
$ autojump do
If you hate typing too, I recommend making an alias for autojump or using the default one.
$ j [name or partial name of the directory]
Another notable feature is that autojump supports both zsh shell and auto-completion. If you are not sure of where you are about to jump, just hit the tabulation key and you will see the full path.
So keeping the same example, typing:
$ autojump d
and then hitting tab will return either /root/home/doc or /root/home/ddl.
Finally for the advanced user, you can access the directory database and modify its content. It then becomes possible to manually add a directory to it via:
$ autojump -a [directory]
If you suddenly want to make it your favorite and most frequently used folder, you can artificially increase its weight by launching from within it the command
$ autojump -i [weight]
This will result in this directory being more likely to be selected to jump to. The opposite would be to decrease its weight with:
$ autojump -d [weight]
To keep track of all these changes, typing:
$ autojump -s
will display the statistics in the database, while:
$ autojump --purge
will remove from the database any directory that does not exist anymore.
To conclude, autojump will be appreciated by all the command line power users. Whether you are ssh-ing into a server, or just like to do things the old fashion way, reducing your navigation time with fewer keystrokes is always a plus. If you are really into that kind of utilities, you should definitely look into Fasd too, which deserves a post in itself.
What do you think of autojump? Do you use it regularly? Let us know in the comments.

9 commands to check hard disk partitions and disk space on Linux

http://www.binarytides.com/linux-command-check-disk-partitions

In this post we are taking a look at some commands that can be used to check up the partitions on your system. The commands would check what partitions there are on each disk and other details like the total size, used up space and file system etc.


Commands like fdisk, sfdisk and cfdisk are general partitioning tools that can not only display the partition information, but also modify them.

1. fdisk

Fdisk is the most commonly used command to check the partitions on a disk. The fdisk command can display the partitions and details like file system type. However it does not report the size of each partitions.
$ sudo fdisk -l

Disk /dev/sda: 500.1 GB, 500107862016 bytes
255 heads, 63 sectors/track, 60801 cylinders, total 976773168 sectors
Units = sectors of 1 * 512 = 512 bytes
Sector size (logical/physical): 512 bytes / 512 bytes
I/O size (minimum/optimal): 512 bytes / 512 bytes
Disk identifier: 0x30093008

   Device Boot      Start         End      Blocks   Id  System
/dev/sda1   *          63   146801969    73400953+   7  HPFS/NTFS/exFAT
/dev/sda2       146802031   976771071   414984520+   f  W95 Ext'd (LBA)
/dev/sda5       146802033   351614654   102406311    7  HPFS/NTFS/exFAT
/dev/sda6       351614718   556427339   102406311   83  Linux
/dev/sda7       556429312   560427007     1998848   82  Linux swap / Solaris
/dev/sda8       560429056   976771071   208171008   83  Linux

Disk /dev/sdb: 4048 MB, 4048551936 bytes
54 heads, 9 sectors/track, 16270 cylinders, total 7907328 sectors
Units = sectors of 1 * 512 = 512 bytes
Sector size (logical/physical): 512 bytes / 512 bytes
I/O size (minimum/optimal): 512 bytes / 512 bytes
Disk identifier: 0x0001135d

   Device Boot      Start         End      Blocks   Id  System
/dev/sdb1   *        2048     7907327     3952640    b  W95 FAT32
Each device is reported separately with details about size, seconds, id and individual partitions.

2. sfdisk

Sfdisk is another utility with a purpose similar to fdisk, but with more features. It can display the size of each partition in MB.
$ sudo sfdisk -l -uM

Disk /dev/sda: 60801 cylinders, 255 heads, 63 sectors/track
Warning: extended partition does not start at a cylinder boundary.
DOS and Linux will interpret the contents differently.
Units = mebibytes of 1048576 bytes, blocks of 1024 bytes, counting from 0

   Device Boot Start   End    MiB    #blocks   Id  System
/dev/sda1   *     0+ 71680- 71681-  73400953+   7  HPFS/NTFS/exFAT
/dev/sda2     71680+ 476938  405259- 414984520+   f  W95 Ext'd (LBA)
/dev/sda3         0      -      0          0    0  Empty
/dev/sda4         0      -      0          0    0  Empty
/dev/sda5     71680+ 171686- 100007- 102406311    7  HPFS/NTFS/exFAT
/dev/sda6     171686+ 271693- 100007- 102406311   83  Linux
/dev/sda7     271694  273645   1952    1998848   82  Linux swap / Solaris
/dev/sda8     273647  476938  203292  208171008   83  Linux

Disk /dev/sdb: 1020 cylinders, 125 heads, 62 sectors/track
Warning: The partition table looks like it was made
  for C/H/S=*/54/9 (instead of 1020/125/62).
For this listing I'll assume that geometry.
Units = mebibytes of 1048576 bytes, blocks of 1024 bytes, counting from 0

   Device Boot Start   End    MiB    #blocks   Id  System
/dev/sdb1   *     1   3860   3860    3952640    b  W95 FAT32
                start: (c,h,s) expected (4,11,6) found (0,32,33)
                end: (c,h,s) expected (1023,53,9) found (492,53,9)
/dev/sdb2         0      -      0          0    0  Empty
/dev/sdb3         0      -      0          0    0  Empty
/dev/sdb4         0      -      0          0    0  Empty


3. cfdisk

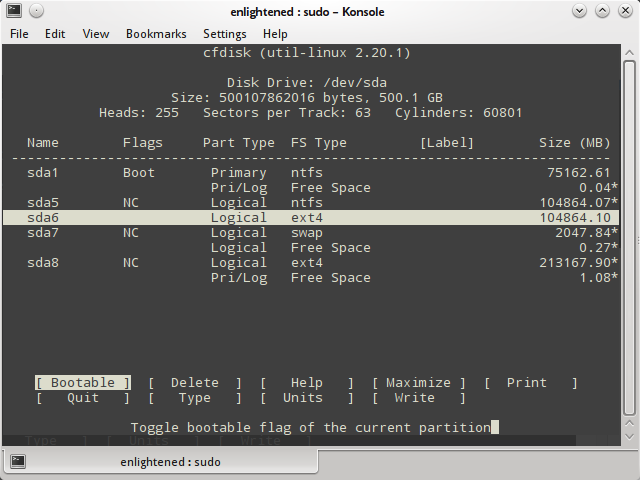
Cfdisk is a linux partition editor with an interactive user interface based on ncurses. It can be used to list out the existing partitions as well as create or modify them.
Here is an example of how to use cfdisk to list the partitions.
linux cfdisk disk partitions
Cfdisk works with one partition at a time. So if you need to see the details of a particular disk, then pass the device name to cfdisk.
$ sudo cfdisk /dev/sdb

4. parted

Parted is yet another command line utility to list out partitions and modify them if needed.
Here is an example that lists out the partition details.
$ sudo parted -l
Model: ATA ST3500418AS (scsi)
Disk /dev/sda: 500GB
Sector size (logical/physical): 512B/512B
Partition Table: msdos

Number  Start   End     Size    Type      File system     Flags
 1      32.3kB  75.2GB  75.2GB  primary   ntfs            boot
 2      75.2GB  500GB   425GB   extended                  lba
 5      75.2GB  180GB   105GB   logical   ntfs
 6      180GB   285GB   105GB   logical   ext4
 7      285GB   287GB   2047MB  logical   linux-swap(v1)
 8      287GB   500GB   213GB   logical   ext4


Model: Sony Storage Media (scsi)
Disk /dev/sdb: 4049MB
Sector size (logical/physical): 512B/512B
Partition Table: msdos

Number  Start   End     Size    Type     File system  Flags
 1      1049kB  4049MB  4048MB  primary  fat32        boot

5. df

Df is not a partitioning utility, but prints out details about only mounted file systems. The list generated by df even includes file systems that are not real disk partitions.
Here is a simple example
$ df -h
Filesystem      Size  Used Avail Use% Mounted on
/dev/sda6        97G   43G   49G  48% /
none            4.0K     0  4.0K   0% /sys/fs/cgroup
udev            3.9G  8.0K  3.9G   1% /dev
tmpfs           799M  1.7M  797M   1% /run
none            5.0M     0  5.0M   0% /run/lock
none            3.9G   12M  3.9G   1% /run/shm
none            100M   20K  100M   1% /run/user
/dev/sda8       196G  154G   33G  83% /media/13f35f59-f023-4d98-b06f-9dfaebefd6c1
/dev/sda5        98G   37G   62G  38% /media/4668484A68483B47
Only the file systems that start with a /dev are actual devices or partitions.
Use grep to filter out real hard disk partitions/file systems.
$ df -h | grep ^/dev
/dev/sda6        97G   43G   49G  48% /
/dev/sda8       196G  154G   33G  83% /media/13f35f59-f023-4d98-b06f-9dfaebefd6c1
/dev/sda5        98G   37G   62G  38% /media/4668484A68483B47
To display only real disk partitions along with partition type, use df like this
$ df -h --output=source,fstype,size,used,avail,pcent,target -x tmpfs -x devtmpfs
Filesystem     Type     Size  Used Avail Use% Mounted on
/dev/sda6      ext4      97G   43G   49G  48% /
/dev/sda8      ext4     196G  154G   33G  83% /media/13f35f59-f023-4d98-b06f-9dfaebefd6c1
/dev/sda5      fuseblk   98G   37G   62G  38% /media/4668484A68483B47
Note that df shows only the mounted file systems or partitions and not all.

6. pydf

Improved version of df, written in python. Prints out all the hard disk partitions in a easy to read manner.
$ pydf
Filesystem Size Used Avail Use%             Mounted on                                 
/dev/sda6   96G  43G   48G 44.7 [####.....] /                                          
/dev/sda8  195G 153G   32G 78.4 [#######..] /media/13f35f59-f023-4d98-b06f-9dfaebefd6c1
/dev/sda5   98G  36G   61G 37.1 [###......] /media/4668484A68483B47
Again, pydf is limited to showing only the mounted file systems.

7. lsblk

Lists out all the storage blocks, which includes disk partitions and optical drives. Details include the total size of the partition/block and the mount point if any.
Does not report the used/free disk space on the partitions.
$ lsblk
NAME   MAJ:MIN RM   SIZE RO TYPE MOUNTPOINT
sda      8:0    0 465.8G  0 disk 
├─sda1   8:1    0    70G  0 part 
├─sda2   8:2    0     1K  0 part 
├─sda5   8:5    0  97.7G  0 part /media/4668484A68483B47
├─sda6   8:6    0  97.7G  0 part /
├─sda7   8:7    0   1.9G  0 part [SWAP]
└─sda8   8:8    0 198.5G  0 part /media/13f35f59-f023-4d98-b06f-9dfaebefd6c1
sdb      8:16   1   3.8G  0 disk 
└─sdb1   8:17   1   3.8G  0 part 
sr0     11:0    1  1024M  0 rom
If there is no MOUNTPOINT, then it means that the file system is not yet mounted. For cd/dvd this means that there is no disk.
Lsblk is capbale of displaying more information about each device like the label and model. Check out the man page for more information

8. blkid

Prints the block device (partitions and storage media) attributes like uuid and file system type. Does not report the space on the partitions.
$ sudo blkid
/dev/sda1: UUID="5E38BE8B38BE6227" TYPE="ntfs" 
/dev/sda5: UUID="4668484A68483B47" TYPE="ntfs" 
/dev/sda6: UUID="6fa5a72a-ba26-4588-a103-74bb6b33a763" TYPE="ext4" 
/dev/sda7: UUID="94443023-34a1-4428-8f65-2fb02e571dae" TYPE="swap" 
/dev/sda8: UUID="13f35f59-f023-4d98-b06f-9dfaebefd6c1" TYPE="ext4" 
/dev/sdb1: UUID="08D1-8024" TYPE="vfat"

9. hwinfo

The hwinfo is a general purpose hardware information tool and can be used to print out the disk and partition list. The output however does not print details about each partition like the above commands.
$ hwinfo --block --short
disk:                                                           
  /dev/sda             ST3500418AS
  /dev/sdb             Sony Storage Media
partition:
  /dev/sda1            Partition
  /dev/sda2            Partition
  /dev/sda5            Partition
  /dev/sda6            Partition
  /dev/sda7            Partition
  /dev/sda8            Partition
  /dev/sdb1            Partition
cdrom:
  /dev/sr0             SONY DVD RW DRU-190A

Summary

The output of parted is concise and complete to get an overview of different partitions, file system on them and the total space. Pydf and df are limited to showing only mounted file systems and the same on them.
Fdisk and Sfdisk show a whole lot of information that can take sometime to interpret whereas, Cfdisk is an interactive partitioning tool that display a single device at a time.
So try them out, and do not forget to comment below.

Sunday, June 22, 2014

10 Tips to Push Your Git Skills to the Next Level

http://www.sitepoint.com/10-tips-git-next-level

Recently we published a couple of tutorials to get you familiar with Git basics and using Git in a team environment. The commands that we discussed were about enough to help a developer survive in the Git world. In this post, we will try to explore how to manage your time effectively and make full use of the features that Git provides.
Note: Some commands in this article include part of the command in square brackets (e.g. git add -p [file_name]). In those examples, you would insert the necessary number, identifier, etc. without the square brackets.

1. Git Auto Completion

If you run Git commands through the command line, it’s a tiresome task to type in the commands manually every single time. To help with this, you can enable auto completion of Git commands within a few minutes.
To get the script, run the following in a Unix system:
1
2
cd ~
curl https://raw.github.com/git/git/master/contrib/completion/git-completion.bash -o ~/.git-completion.bash
Next, add the following lines to your ~/.bash_profile file:
1
2
3
if [ -f ~/.git-completion.bash ]; then
    . ~/.git-completion.bash
fi
Although I have mentioned this earlier, I can not stress it enough: If you want to use the features of Git fully, you should definitely shift to the command line interface!

2. Ignoring Files in Git

Are you tired of compiled files (like .pyc) appearing in your Git repository? Or are you so fed up that you have added them to Git? Look no further, there is a way through which you can tell Git to ignore certain files and directories altogether. Simply create a file with the name .gitignore and list the files and directories that you don’t want Git to track. You can make exceptions using the exclamation mark(!).
1
2
3
4
5
*.pyc
*.exe
my_db_config/
 
!main.pyc

3. Who Messed With My Code?

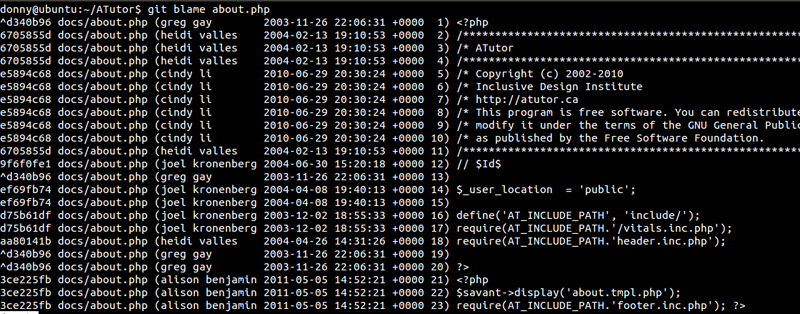
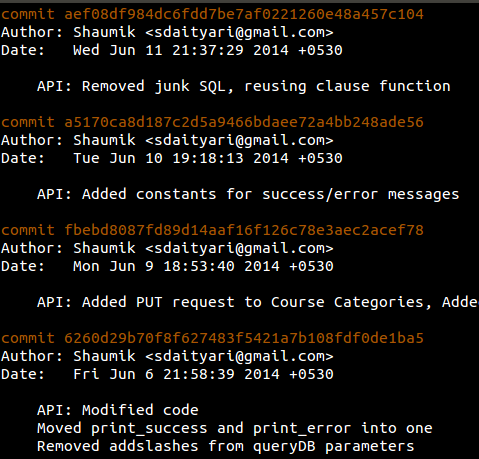
It’s the natural instinct of human beings to blame others when something goes wrong. If your production server is broke, it’s very easy to find out the culprit — just do a git blame. This command shows you the author of every line in a file, the commit that saw the last change in that line, and the timestamp of the commit.
1
git blame [file_name]
git blame demonstration
And in the screenshot below, you can see how this command would look on a bigger repository:
git blame on the ATutor repository

4. Review History of the Repository

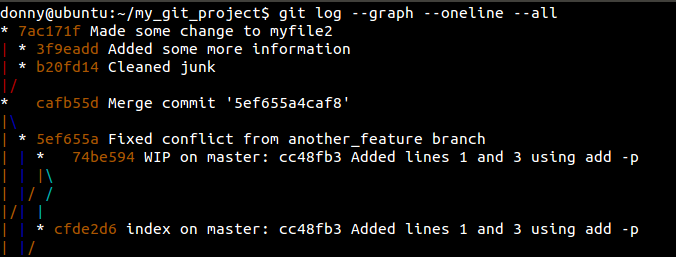
We had a look at the use of git log in a previous tutorial, however, there are three options that you should know about.
  • --oneline – Compresses the information shown beside each commit to a reduced commit hash and the commit message, all shown in a single line.
  • --graph – This option draws a text-based graphical representation of the history on the left hand side of the output. It’s of no use if you are viewing the history for a single branch.
  • --all – Shows the history of all branches.
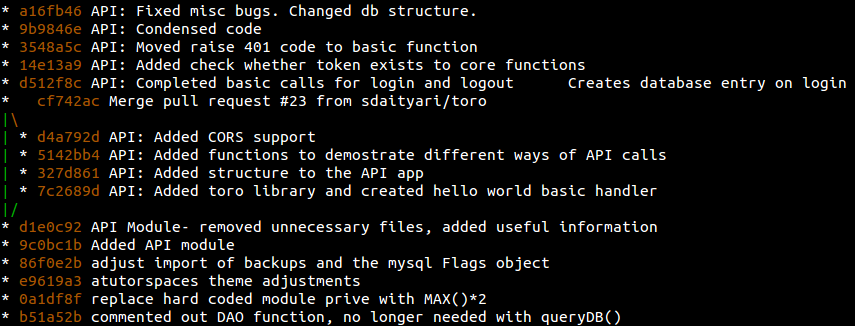
Here’s what a combination of the options looks like:
Use of git log with all, graph and oneline

5. Never Lose Track of a Commit

Let’s say you committed something you didn’t want to and ended up doing a hard reset to come back to your previous state. Later, you realize you lost some other information in the process and want to get it back, or at least view it. This is where git reflog can help.
A simple git log shows you the latest commit, its parent, its parent’s parent, and so on. However, git reflog is a list of commits that the head was pointed to. Remember that it’s local to your system; it’s not a part of your repository and not included in pushes or merges.
If I run git log, I get the commits that are a part of my repository:
Project history
However, a git reflog shows a commit (b1b0ee9HEAD@{4}) that was lost when I did a hard reset:
Git reflog

6. Staging Parts of a Changed File for a Commit

It is generally a good practice to make feature-based commits, that is, each commit must represent a feature or a bug fix. Consider what would happen if you fixed two bugs, or added multiple features without committing the changes. In such a situation situation, you could put the changes in a single commit. But there is a better way: Stage the files individually and commit them separately.
Let’s say you’ve made multiple changes to a single file and want them to appear in separate commits. In that case, we add files by prefixing -p to our add commands.
1
git add -p [file_name]
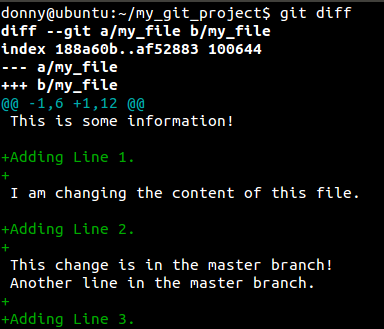
Let’s try to demonstrate the same. I have added three new lines to file_name and I want only the first and third lines to appear in my commit. Let’s see what a git diff shows us.
Changes in repo
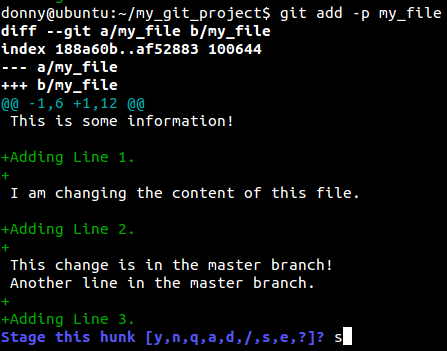
And let’s see what happes when we prefix a -p to our add command.
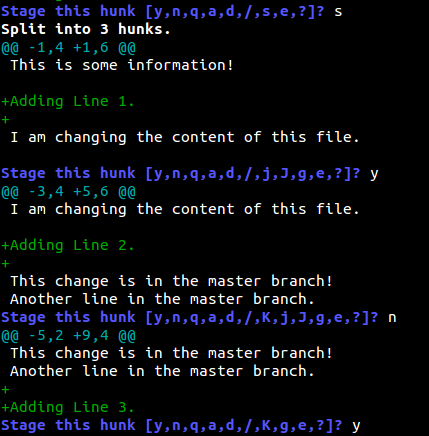
Running add with -p
It seems that Git assumed that all the changes were a part of the same idea, thereby grouping it into a single hunk. You have the following options:
  • Enter y to stage that hunk
  • Enter n to not stage that hunk
  • Enter e to manually edit the hunk
  • Enter d to exit or go to the next file.
  • Enter s to split the hunk.
In our case, we definitely want to split it into smaller parts to selectively add some and ignore the rest.
Adding all hunks
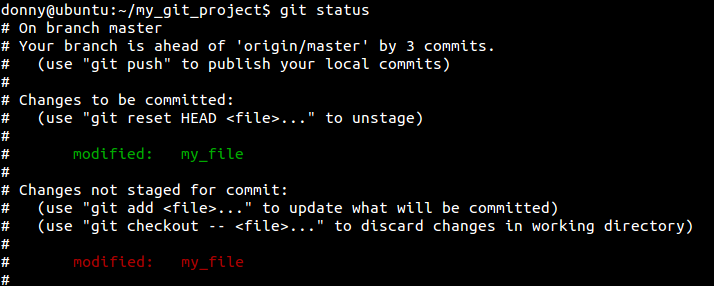
As you can see, we have added the first and third lines and ignored the second. You can then view the status of the repository and make a commit.
Repository after selectively adding a file

7. Squash Multiple Commits

When you submit your code for review and create a pull request (which happens often in open source projects), you might be asked to make a change to your code before it’s accepted. You make the change, only to be asked to change it yet again in the next review. Before you know it, you have a few extra commits. Ideally, you could squash them into one using the rebase command.
1
git rebase -i HEAD~[number_of_commits]
If you want to squash the last two commits, the command that you run is the following.
1
git rebase -i HEAD~2
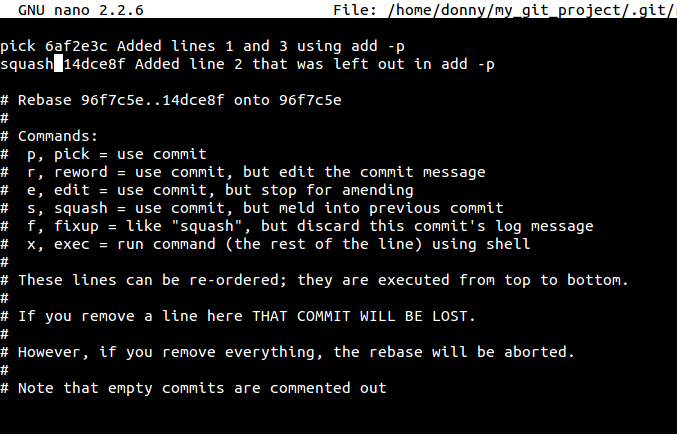
On running this command, you are taken to an interactive interface listing the commits and asking you which ones to squash. Ideally, you pick the latest commit and squash the old ones.
Git squash interactive
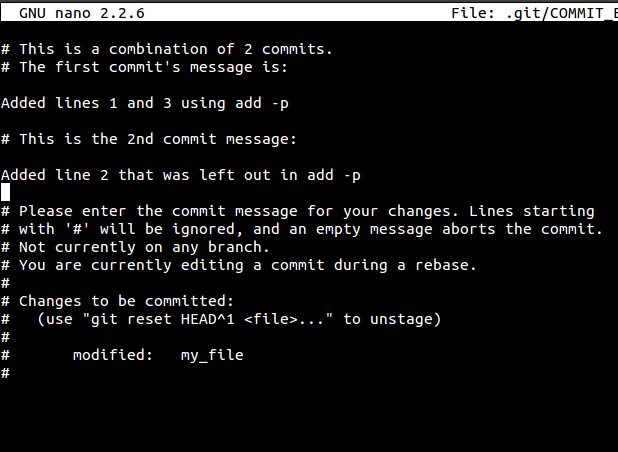
You are then asked to provide a commit message to the new commit. This process essentially re-writes your commit history.
Adding a commit message

8. Stash Uncommitted Changes

Let’s say you are working on a certain bug or a feature, and you are suddenly asked to demonstrate your work. Your current work is not complete enough to be committed, and you can’t give a demonstration at this stage (without reverting the changes). In such a situation, git stash comes to the rescue. Stash essentially takes all your changes and stores them for further use. To stash your changes, you simply run the following-
1
git stash
To check the list of stashes, you can run the following:
1
git stash list
Stash list
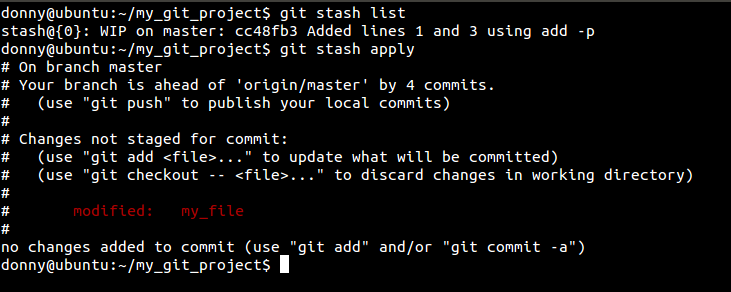
If you want to un-stash and recover the uncommitted changes, you apply the stash:
1
git stash apply
In the last screenshot, you can see that each stash has an indentifier, a unique number (although we have only one stash in this case). In case you want to apply only selective stashes, you add the specific identifier to the apply command:
1
git stash apply stash@{2}
After un-stashing changes

9. Check for Lost Commits

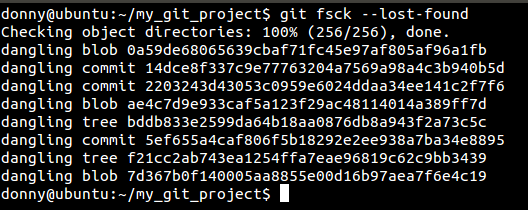
Although reflog is one way of checking for lost commits, it’s not feasible in large repositories. That is when the fsck (file system check) command comes into play.
1
git fsck --lost-found
Git fsck results
Here you can see a lost commit. You can check the changes in the commit by running git show [commit_hash] or recover it by running git merge [commit_hash].
git fsck has an advantage over reflog. Let’s say you deleted a remote branch and then cloned the repository. With fsck you can search for and recover the deleted remote branch.

10. Cherry Pick

I have saved the most elegant Git command for the last. The cherry-pick command is by far my favorite Git command, because of its literal meaning as well as its utility!
In the simplest of terms, cherry-pick is picking a single commit from a different branch and merging it with your current one. If you are working in a parallel fashion on two or more branches, you might notice a bug that is present in all branches. If you solve it in one, you can cherry pick the commit into the other branches, without messing with other files or commits.
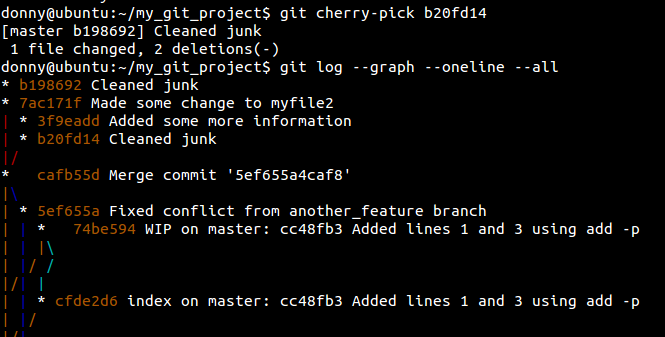
Let’s consider a scenario where we can apply this. I have two branches and I want to cherry-pick the commit b20fd14: Cleaned junk into another one.
Before cherry pick
I switch to the branch into which I want to cherry-pick the commit, and run the following:
1
git cherry-pick [commit_hash]
After cherry pick
Although we had a clean cherry-pick this time, you should know that this command can often lead to conflicts, so use it with care.

Conclusion

With this, we come to the end of our list of tips that I think can help you take your Git skills to a new level. Git is the best out there and it can accomplish anything you can imagine. Therefore, always try to challenge yourself with Git. Chances are, you will end up learning something new!

Monday, June 16, 2014

How to Rescue a Non-booting GRUB 2 on Linux

http://www.linux.com/learn/tutorials/776643-how-to-rescue-a-non-booting-grub-2-on-linux

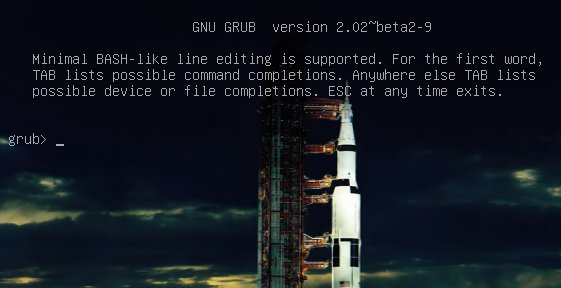
grub command shell
Figure 1: GRUB 2 menu with cool Apollo 17 background.
Once upon a time we had legacy GRUB, the Grand Unified Linux Bootloader version 0.97. Legacy GRUB had many virtues, but it became old and its developers did yearn for more functionality, and thus did GRUB 2 come into the world. GRUB 2 is a major rewrite with several significant differences. It boots removable media, and can be configured with an option to enter your system BIOS. It's more complicated to configure with all kinds of scripts to wade through, and instead of having a nice fairly simple /boot/grub/menu.lst file with all configurations in one place, the default is /boot/grub/grub.cfg. Which you don't edit directly, oh no, for this is not for mere humans to touch, but only other scripts. We lowly humans may edit /etc/default/grub, which controls mainly the appearance of the GRUB menu. We may also edit the scripts in /etc/grub.d/. These are the scripts that boot your operating systems, control external applications such as memtest and os_prober, and theming./boot/grub/grub.cfg is built from /etc/default/grub and /etc/grub.d/* when you run the update-grub command, which you must run every time you make changes.
The good news is that the update-grub script is reliable for finding kernels, boot files, and adding all operating systems to your GRUB boot menu, so you don't have to do it manually.
We're going to learn how to fix two of the more common failures. When you boot up your system and it stops at the grub> prompt, that is the full GRUB 2 command shell. That means GRUB 2 started normally and loaded the normal.mod module (and other modules which are located in /boot/grub/[arch]/), but it didn't find your grub.cfg file. If you see grub rescue> that means it couldn't find normal.mod, so it probably couldn't find any of your boot files.
How does this happen? The kernel might have changed drive assignments or you moved your hard drives, you changed some partitions, or installed a new operating system and moved things around. In these scenarios your boot files are still there, but GRUB can't find them. So you can look for your boot files at the GRUB prompt, set their locations, and then boot your system and fix your GRUB configuration.

GRUB 2 Command Shell

The GRUB 2 command shell is just as powerful as the shell in legacy GRUB. You can use it to discover boot images, kernels, and root filesystems. In fact, it gives you complete access to all filesystems on the local machine regardless of permissions or other protections. Which some might consider a security hole, but you know the old Unix dictum: whoever has physical access to the machine owns it.
When you're at the grub> prompt, you have a lot of functionality similar to any command shell such as history and tab-completion. The grub rescue> mode is more limited, with no history and no tab-completion.
If you are practicing on a functioning system, press C when your GRUB boot menu appears to open the GRUB command shell. You can stop the bootup countdown by scrolling up and down your menu entries with the arrow keys. It is safe to experiment at the GRUB command line because nothing you do there is permanent. If you are already staring at the grub> or grub rescue>prompt then you're ready to rock.
The next few commands work with both grub> and grub rescue>. The first command you should run invokes the pager, for paging long command outputs:
grub> set pager=1
There must be no spaces on either side of the equals sign. Now let's do a little exploring. Type ls to list all partitions that GRUB sees:
grub> ls
(hd0) (hd0,msdos2) (hd0,msdos1)
What's all this msdos stuff? That means this system has the old-style MS-DOS partition table, rather than the shiny new Globally Unique Identifiers partition table (GPT). (See Using the New GUID Partition Table in Linux (Goodbye Ancient MBR). If you're running GPT it will say (hd0,gpt1). Now let's snoop. Use the ls command to see what files are on your system:
grub> ls (hd0,1)/
lost+found/ bin/ boot/ cdrom/ dev/ etc/ home/  lib/
lib64/ media/ mnt/ opt/ proc/ root/ run/ sbin/ 
srv/ sys/ tmp/ usr/ var/ vmlinuz vmlinuz.old 
initrd.img initrd.img.old
Hurrah, we have found the root filesystem. You can omit the msdos and gpt labels. If you leave off the slash it will print information about the partition. You can read any file on the system with the cat command:
grub> cat (hd0,1)/etc/issue
Ubuntu 14.04 LTS \n \l
Reading /etc/issue could be useful on a multi-boot system for identifying your various Linuxes.

Booting From grub>

This is how to set the boot files and boot the system from the grub> prompt. We know from running the ls command that there is a Linux root filesystem on (hd0,1), and you can keep searching until you verify where /boot/grub is. Then run these commands, using your own root partition, kernel, and initrd image:
grub> set root=(hd0,1)
grub> linux /boot/vmlinuz-3.13.0-29-generic root=/dev/sda1
grub> initrd /boot/initrd.img-3.13.0-29-generic
grub> boot
The first line sets the partition that the root filesystem is on. The second line tells GRUB the location of the kernel you want to use. Start typing /boot/vmli, and then use tab-completion to fill in the rest. Type root=/dev/sdX to set the location of the root filesystem. Yes, this seems redundant, but if you leave this out you'll get a kernel panic. How do you know the correct partition? hd0,1 = /dev/sda1. hd1,1 = /dev/sdb1. hd3,2 = /dev/sdd2. I think you can extrapolate the rest.
The third line sets the initrd file, which must be the same version number as the kernel.
The fourth line boots your system.
On some Linux systems the current kernels and initrds are symlinked into the top level of the root filesystem:
$ ls -l /
vmlinuz -> boot/vmlinuz-3.13.0-29-generic
initrd.img -> boot/initrd.img-3.13.0-29-generic
So you could boot from grub> like this:
grub> set root=(hd0,1)
grub> linux /vmlinuz root=/dev/sda1
grub> initrd /initrd.img
grub> boot

Booting From grub-rescue>

If you're in the GRUB rescue shell the commands are different, and you have to load the normal.mod andlinux.mod modules:
grub rescue> set prefix=(hd0,1)/boot/grub
grub rescue> set root=(hd0,1)
grub rescue> insmod normal
grub rescue> normal
grub rescue> insmod linux
grub rescue> linux /boot/vmlinuz-3.13.0-29-generic root=/dev/sda1
grub rescue> initrd /boot/initrd.img-3.13.0-29-generic
grub rescue> boot
Tab-completion should start working after you load both modules.

Making Permanent Repairs

When you have successfully booted your system, run these commands to fix GRUB permanently:
# update-grub
Generating grub configuration file ...
Found background: /usr/share/images/grub/Apollo_17_The_Last_Moon_Shot_Edit1.tga
Found background image: /usr/share/images/grub/Apollo_17_The_Last_Moon_Shot_Edit1.tga
Found linux image: /boot/vmlinuz-3.13.0-29-generic
Found initrd image: /boot/initrd.img-3.13.0-29-generic
Found linux image: /boot/vmlinuz-3.13.0-27-generic
Found initrd image: /boot/initrd.img-3.13.0-27-generic
Found linux image: /boot/vmlinuz-3.13.0-24-generic
Found initrd image: /boot/initrd.img-3.13.0-24-generic
Found memtest86+ image: /boot/memtest86+.elf
Found memtest86+ image: /boot/memtest86+.bin
done
# grub-install /dev/sda
Installing for i386-pc platform.
Installation finished. No error reported.
When you run grub-install remember you're installing it to the boot sector of your hard drive and not to a partition, so do not use a partition number like /dev/sda1.

But It Still Doesn't Work

If your system is so messed up that none of this works, try the Super GRUB2 live rescue disk. The official GNU GRUB Manual 2.00 should also be helpful.