Wednesday, September 16, 2015

Schedule FiOS Router Reboots with a Pogoplug

http://freedompenguin.com/articles/how-to/schedule-fios-router-reboots-with-a-pogoplug


There are few things in life more irritating than having your Internet go out. This is often caused by your router needing a reboot. Sadly, not all routers are created equal which complicates things a bit. At my home for example, we have FIOS Internet. My connection from my ONT to my FIOS router is through coaxial (coax cable). Why does this matter? Because if I was connected to CAT6 from my ONT, I could use the router of my choosing. Sadly a coaxial connection doesn’t easily afford me this opportunity.
So why don’t I just switch my FIOS over to CAT6 instead of using the coaxial cable? Because I have no interest in running the CAT6 throughout my home. This means I must get the most out of my ISP provided router as possible.
What is so awful about using the Actiontec router?
1) The Actiontec router overheats when using wifi and router duties.
2) This router has a small NAT table that means frequent rebooting is needed.
Thankfully, I’m pretty good at coming up with reliable solutions. To tackle the first issue, I simply turned off the wifi portion of the Actiontec router. This allowed me to connect to my own personal WiFi instead. As for the second problem, this was a bit trickier. Having tested the “Internet Only Bridge” approach for the Actiontec and watching it fail often, I finally settled on using my own personal router as a switch instead. It turned out to be far more reliable and I wasn’t having to mess with it every time my ISP renewed a new IP address. Trust me when I say I’m well aware of ALL of the options and this is what works best for me. Okay, moving on.
Automatic rebooting
As reliable as my current setup is, there is still the issue of the small NAT table with the Actiontec. Being the sort of person who likes simple, I usually just reboot the router when things start slowing down. It’s rarely needed, however getting to the box is a pain in the butt.
This lead me on a mission: how can I automatically reboot my router without buying any extra hardware? I’m on a budget, so simply buying one of those IP-enabled remote power switches wasn’t something I was going to do. After all, if the thing stops working, I’m left with a useless brick.
Instead, I decided to build my own. Looking around in my “crap box”, I discovered two Pogoplugs I had forgotten about. These devices provide photo backup and sharing for the less tech savvy among us. All I need to do was install Linux onto the Pogoplug device.
Why would someone choose a Pogoplug vs a Rasberry Pi? Easy, the Pogoplugs are “stupid cheap.” According to the current listings on Amazon, a Pi Model B+ is $32 and a Pi 2 will run $41 USD. Compare that to $10 for a new Pogoplug and it’s obvious which option makes the most sense. I’d much rather free up my Pi for other duties than merely managing my router’s ability to reboot itself.

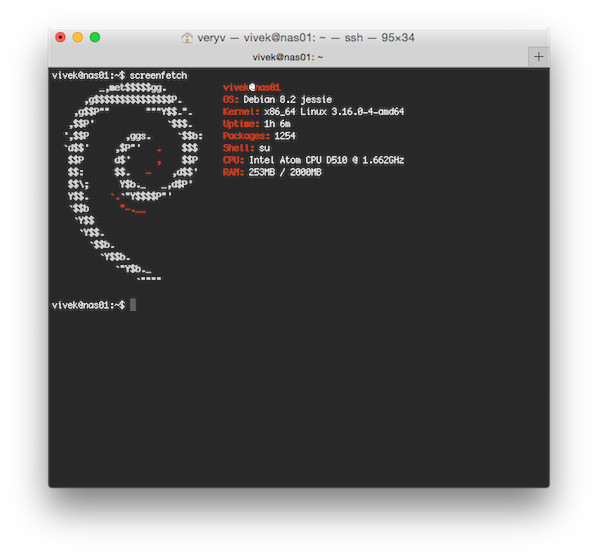
Installing Debian onto the Pogoplug

I should point out that most of the tutorials regarding installing Debian (or any Linux distro) onto a Pogoplug are missing information, half-wrong and almost certain to brick the device. After extensive research I found a tutorial that provides complete, accurate information. Based on that research, I recommend using the tutorial for the Pogoplug v4 (both Series 4 and Mobile). If you try out the linked tutorial on other Pogoplug models you will “brick” the Pogoplug.
Getting started: When running the curl command (for dropbear), if you are getting errors – leave the box plugged in and Ethernet connected for at least an hour. If you continue to see the error: “pogoplug curl: (7) Failed to connect to”, then you need to contact Pogoplug to have them de-register the device.
Pogoplug Support Email
If installing Debian on the Pogoplug sounds scary or you’ve already got a Raspberry Pi running Linux that you’re not using, then you’re ready for the next step.
Setting up your router reboot box
(Hat tip to Verizon Forums)
Important: After you’ve installed Debian onto your Pogoplug v4 (or setup your existing Rasberry Pi instead), you would be wise to consider setting up a common non-root user for casual SSH sessions. Even though this is behind your router’s firewall, you’re still running a Linux box as root with various open ports.
First up, login to your Actiontec MI424WR (or similar) FIOS router, browse to Advanced, click Yes to acknowledge the warning, then click on Local Administration on the bottom left. Check “Using Primary Telnet Port (23)” and hit Apply. This is for local administration only and is not to be confused with Remote Administration settings.
Go ahead and SSH into your newly tweaked Pogoplug. Next, you’re going to want to install a package called “expect.” Assuming you’re not running as root, we’ll be using “sudo” for this demonstration. I first discovered this concept on the Verizon forums last year. Even though it was scripted for a Pi, I found it also works great on the Pogoplug. SSH into your Pogoplug:
  1. cd /home/non-root-username/
  1. sudo apt-get install expect -y
Next, run nano in a terminal and paste in the following contents, edit any mention of your /home/non-root-username/ and your router’s IP LAN address to match your personal details.
  1. spawn telnet 192.168.1.1
  2. expect "Username:"
  3. send "admin\r"
  4. expect "Password:"
  5. send "ACTUAL-ROUTER-password\r"
  6. expect "Wireless Broadband Router> "
  7. sleep 5
  8. send "system reboot\r"
  9. sleep 5
  10. send "exit\r"
  11. close
  12. sleep 5
  13. exit
Now name the file verizonrouterreboot.expect and save it. You’ll note that we’re saving this in your /home/non-root-username/ directory. You could call the file anything you like, but for the sake of consistency, I’m sticking with the file names as I have them.
The file we just created accesses the router via telnet (locally), then using hard returns (\r) is logging into the router and rebooting it. Clearly this file on it’s own would be annoying, since executing it just reboots your router. However it does provide the executable for our next file so that we can automate when we want it to run.
Let’s open nano in the same directory and paste in the following contents:
  1. {
  2. cd /home/non-root-username/
  3. expect -f verizonrouterreboot.expect
  4. echo "\r"
  5. } 2>&1 > /home/non-root-username/verizonrouterreboot.log
  6. echo "Nightly Reboot Successful: $(date)" >> /home/non-root-username/successful.log
  7. sleep 3
  8. exit
Now save this file as verizonrouterreboot.sh so it can provide you with a log file and run your expect script.
As an added bonus, I’m going to also provide you with a script that will reboot the router if the Internet goes out or the router isn’t connecting with your ISP.
Once again, open up nano in the same directory and drop the following into it:
  1. #!/bin/bash
  2. if ping -c 1 208.67.220.220
  3. then
  4. : # colon is a null and is required
  5. else
  6. /home/non-root-username/verizonrouterreboot.sh
  7. fi
Save this file as pingme.sh and it will make sure you’ll never have to go fishing for the power outlet ever again. This script is designed to ping an OpenDNS server on a set schedule (explained shortly). If the ping fails, it then runs the reboot script.
Before I wrap this up, there are two things that must still be done to make this work. First, we need to make sure these files can be executed.
  1. chmod +x /verizonrouterreboot.sh
  1. chmod +x verizonrouterreboot.expect
  1. chmod +x pingme.sh
Pogoplug Debian
Pogoplug Debian
Now that our scripts are executable, the next step is to schedule the scripts on their appropriate schedules. My recommendation is to schedule verizonrouterreboot.sh at a time when no one is using the computer, say at 4am. And I recommend running “pingme” every 30 minutes. After all, who wants to be without the Internet for more than 30 minutes? You can setup a cron job and then verify your schedule is set up correctly.
Are you a cable Internet user?
You are? That’s awesome! As luck would have it, I’m working on two different approaches for automatically rebooting cable modems. If you use a cable modem and would be interested in helping me test these techniques out, HIT THE COMMENTS and let’s put our heads together. Let me know if you’re willing to help me do some testing!
I need to be able to test both the “telnet method” and the “wget to url” method with your help. Ideally if both work, this will cover most cable modem types and reboot methods.

How to install Ioncube Loader on CentOS, Debian and Ubuntu

https://www.howtoforge.com/tutorial/how-to-install-ioncube-loader

The Ioncube loader is a PHP module to load files that were protected with the Ioncube Encoder software. Ioncube is often used by commercial PHP software vendors to protect their software, so it is likely that you come across an Ioncube encoded file sooner or later when you install extensions for CMS or Shop software written in PHP. In this tutorial, I will explain the installation of the Ioncube loader module in detail for CentOS, Debian, and Ubuntu.

1 Prerequisites

Your server must have the PHP programming language installed. I will use the command line Editor Nano and the command line download application wget. Nano and Wget are installed on most servers, in case they are missing on your server then install them with apt / yum:

CentOS

yum install nano wget

Debian and Ubuntu

apt-get install nano wget

2 Download Ioncube Loader

The Ioncube loader files can be downloaded free of charge from Ioncube Inc. They exist for 32Bit and 64Bit Linux systems.
In the first step, I will check if the server is a 32Bit or 64Bit system. Run:
uname -a
The output will be similar to this:
Run uname -a command.
When the text contains "x86_64" then the server runs a 64Bit Linux Kerbel, otherwise it's a 32Bit (i386) Kernel. Most current Linux servers run a 64Bit Kernel.
Download the Loader in tar.gz format to the /tmp folder and unpack it:
For 64Bit x86_64 Linux:
cd /tmp
wget http://downloads3.ioncube.com/loader_downloads/ioncube_loaders_lin_x86-64.tar.gz
tar xfz ioncube_loaders_lin_x86-64.tar.gz
For 32Bit i386 Linux:
cd /tmp
wget http://downloads3.ioncube.com/loader_downloads/ioncube_loaders_lin_x86.tar.gz
tar xfz ioncube_loaders_lin_x86.tar.gz
The files get unpacked into a folder with the name "ioncube".

3 Which Ioncube Loader is the right one?

When you run "ls /tmp/ioncube" then you see that there are many loader files in the ioncube directory.
List of ioncube loader files.
The files have a number that corresponds with the PHP version they are made for and there is also a "_ts" (Thread Safe) version of each loader. We will use the version without thread safety here.
To find out the installed php version, run the command:
php -v
The output will be similar to this:
The php -v output.
For this task only the first two digits of the version number in the first result line matter, on this server I'll run PHP 5.6. We note this number as we need it for the next steps.
Now it's time to find out where the extension directory of this PHP version is, run the following command to find the directory name:
php -i | grep extension_dir
The output should be similar to the one from this screenshot:
The PHP extension directory path.
I marked the path in the screenshot, the extension directory on this server is "/usr/lib/php5/20131226". The directory name will be different for each PHP version and Linux distribution, jus use the one you get from the command and not the one that I got here.
No well copy the ioncube loader for our PHP version 5.6 to the extension directory /usr/lib/php5/20131226:
cp /tmp/ioncube/ioncube_loader_lin_5.6.so /usr/lib/php5/20131226/
Replace "5.6" in the above with your PHP version and "/usr/lib/php5/20131226" with the extension directory of your PHP version.

4 Configure PHP for the Ioncube Loader

The next configuration step is a bit different for Centos and Debian/Ubuntu. We will have to add a line:
zend_extension = /usr/lib/php5/20131226/ioncube_loader_lin_5.6.so
as first line into the php.ini file(s) of the system. Again, the above path contains the extension directory "/usr/lib/php5/20131226" and the PHP version "5.6", ensure that you replace them to match your system setup. I'll start with the instructions for CentOS.

3.1 Configure Ioncube loader on CentOS

Centos has just one central phhp.ini file where we have to add the ioncube loader to. Open the file /etc/php.ini with an editor:
nano /etc/php.ini
and add "zend_extension =" plus the path to the ioncube loader as the first line in the file.
zend_extension = /usr/lib/php5/20131226/ioncube_loader_lin_5.6.so
Then save the file and restart the apache web server:
service httpd restart
service php-fpm restart

3.1 Configure Ioncube loader on Debian and Ubuntu

Debian and Ubuntu use separate php.ini files for PHP CLI (Commandline), CGI, Apache2 and FPM mode. The file paths are:
  • /etc/php5/apache2/php.ini
  • /etc/php5/cli/php.ini
  • /etc/php5/cgi/php.ini
  • /etc/php5/fpm/php.ini
A file has to be edited to enable the ioncube loader into the corresponding PHP mode. You are free to leave out files for PHP modes that you don't use or where you don't need ioncube loader support. It is also possible that you don't have all files on your server, so don't worry when you can't find one of the files.
Apache mod_php
nano /etc/php5/apache2/php.ini
Command line PHP (CLI)
nano /etc/php5/cli/php.ini
PHP CGI (used for CGI and Fast_CGI modes)
nano /etc/php5/cgi/php.ini
PHP FPM
nano /etc/php5/fpm/php.ini
and add "zend_extension =" plus the path to the ioncube loader as the first line in the file(s).
zend_extension = /usr/lib/php5/20131226/ioncube_loader_lin_5.6.so
Then save the file(s) and restart the apache webserver and php-fpm:
service apache2 restart
service php5-fpm restart

5 Test Ioncube

Let's check if ioncube loader has been installed successfully. First I will test the commandline PHP. Run:
php -v
Ioncube loaded in cli PHP.
I marked the line in white that shows that the ioncube loader has been enabled:
with the ionCube PHP Loader (enabled) + Intrusion Protection from ioncube24.com (unconfigured) v5.0.17, Copyright (c) 2002-2015, by ionCube Ltd.
If you like to test the PHP of a website, create an "info.php file with this content:
phpinfo();
?>
And open the URL in a web browser. You will be able to see ioncube in the phpinfo() output:
PHP info output with ioncube module loaded.

How to extend GIMP with GMIC

https://www.howtoforge.com/tutorial/how-to-extend-gimp-with-gmic

GIMP is the n1 open source image editor and raster graphics manipulator that offers an array of special effects and filters out of the box. Although the software's default capabilities will be more than enough for most people out there, there isn't any reason why you couldn't expand them if you wished for it. While there are many ways to do exactly that, I will focus on how to enrich your GIMP filters and effects sets with the use of G'MIC.

Extend GIMP with G'MIC

G'MIC is an acronym for GREYC's Magic for Image Computing and it is basically an open-source image processing framework that can be used through the command line, online, or on GIMP in the form of an external plugin. As a plugin, it boasts over 400 additional filters and effects, so the expansion of GIMP's possibilities is significant and important.
First, thing you need to do is download the plugin from G'MIC's download web page. Note that the plugin is available in both 32 and 64-bit architectures and that it has to match your existing GIMP (and OS) installation to work. Download the proper G'MIC version and decompress the contents of the downloaded file under the /.gimp-2.8/plug-ins directory. This is a “hidden” directory so you'll have to press “Ctrl+H” when in your Home folder and then locate the folder.
Note that the G'MIC plugin is actually an executable that must be placed in the directory “/.gimp-2.8/plug-ins”. The directory structure is important as placing the G'MIC folder in the plug-ins won't change anything on GIMP.
After having done that, close your GIMP (if open) and restart it. If the plugin was installed correctly, you should be seeing a “G'MIC” entry in the “Filters” options menu. Pressing it will open up a new window that contains all of the new filters and effects.
Each filter features adjustable settings on the right size of the window, while a convenient preview screen is placed on the left. Users may also use specific layers to apply filters on, or even use their own G'MIC code as a new “custom filter”.
While many of the G'MIC filters are already available in GIMP, you will find a lot that aren't so dig deep and locate the one thing that you need every time. Luckily, G'MIC offers categorization for its multitudinous effects collection.

Install G'MIC on Ubuntu

If you're using Ubuntu derivatives, you can also install G'MIC through a third party repository. You can add it at your own risk by entering the following commands on a terminal:
sudo add-apt-repository ppa:otto-kesselgulasch/gimp
sudo apt-get update
sudo apt-get install gimp-gmic
The benefit from doing this is that you will get G'MIC updates whenever there are any, instead of having to download the latest version and to untar the file in the appropriate folder again.

Other GIMP Plugins

G'MIC is certainly great for when you're looking for a filtering extension, but here are some other GIMP plugins that will help you expand other aspects of this powerful software. The GIMP Paint Studio for example is great when in need for additional brushes and their accompanying tool presets, the GIMP Animation Package helps you create simple animations, and finally the FX-Foundry Scripts Pack is a selection of high-quality scripts that do wonders in many cases.

Yawls: Let Your Webcam Adjust Your Laptop Screen Brightness in Ubuntu/Linux Mint

http://www.noobslab.com/2015/06/yawls-let-your-webcam-adjust-your.html

Yawls stands for Yet Another Webcam Light Sensor, it is a small Java program created for Ubuntu, it adjust the brightness level of your display by using the internal/externel webcam of your notebook as an ambient light sensor, that uses the OpenCV Library and designed to comfort and save energy of your laptop battery. Yawls can also be used from command line interface and run itself as a system daemon, two times a minute it runs and adjusts the brightness of the notebook screen with reference to the ambient brightness. It doesn't engage webcam constantly, as mentioned above in a 30 seconds interval it uses the webcam and leave it for other programs to use. The interval time can be adjust from GUI or from config file if you are using CLI version
It also has face detection option which can be useful if you sits in dark room and yawls can adjust screens brightness as per your needs, by default this option is disabled, you can enable if you intend to use it. After very first installation you must calibrate yawls otherwise it may not function properly. If it causes problem somewhere between usage then re-calibrate it. If you found any kind of bug in the application then report it via github or launchpad.


Installation:
It can be installed in Ubuntu 15.04 Vivid/Ubuntu 15.10/14.04 Trusty/Linux Mint 17.x/17/other related Ubuntu derivatives.
First of all you must enable universe repository from Ubuntu software sources then proceed to install this deb file.


What do you think about this application?

Display Awesome Linux Logo With Basic Hardware Info Using screenfetch and linux_logo Tools

http://www.cyberciti.biz/hardware/howto-display-linux-logo-in-bash-terminal-using-screenfetch-linux_logo

Do you want to display a super cool logo of your Linux distribution along with basic hardware information? Look no further try awesome screenfetch and linux_logo utilities.

Say hello to screenfetch

screenFetch is a CLI bash script to show system/theme info in screenshots. It runs on a Linux, OS X, FreeBSD and many other Unix-like system. From the man page:
This handy Bash script can be used to generate one of those nifty terminal theme information + ASCII distribution logos you see in everyone's screenshots nowadays. It will auto-detect your distribution and display an ASCII version of that distribution's logo and some valuable information to the right.

Installing screenfetch on Linux

Open the Terminal application. Simply type the following apt-get command on a Debian or Ubuntu or Mint Linux based system:
$ sudo apt-get install screenfetch
Fig.01: Installing screenfetch using apt-get

Installing screenfetch Mac OS X

Type the following command:
$ brew install screenfetch
Fig.02: Installing screenfetch using brew command

Installing screenfetch on FreeBSD

Type the following pkg command:
$ sudo pkg install sysutils/screenfetch
Fig.03: FreeBSD install screenfetch using pkg

Installing screenfetch on Fedora Linux

Type the following dnf command:
$ sudo dnf install screenfetch
Fig.04: Fedora Linux 22 install screenfetch using dnf

How do I use screefetch utility?

Simply type the following command:
$ screenfetch
Here is the output from various operating system:

Take screenshot

To take a screenshot and to save a file, enter:
$ screenfetch -s
You will see a screenshot file at ~/Desktop/screenFetch-*.jpg. To take a screenshot and upload to imgur directly, enter:
$ screenfetch -su imgur
Sample outputs:
                 -/+:.          veryv@Viveks-MacBook-Pro
                :++++.          OS: 64bit Mac OS X 10.10.5 14F27
               /+++/.           Kernel: x86_64 Darwin 14.5.0
       .:-::- .+/:-``.::-       Uptime: 3d 1h 36m
    .:/++++++/::::/++++++/:`    Packages: 56
  .:///////////////////////:`   Shell: bash 3.2.57
  ////////////////////////`     Resolution: 2560x1600 1920x1200
 -+++++++++++++++++++++++`      DE: Aqua
 /++++++++++++++++++++++/       WM: Quartz Compositor
 /sssssssssssssssssssssss.      WM Theme: Blue
 :ssssssssssssssssssssssss-     Font: Not Found
  osssssssssssssssssssssssso/`  CPU: Intel Core i5-4288U CPU @ 2.60GHz
  `syyyyyyyyyyyyyyyyyyyyyyyy+`  GPU: Intel Iris
   `ossssssssssssssssssssss/    RAM: 6405MB / 8192MB
     :ooooooooooooooooooo+.
      `:+oo+/:-..-:/+o+/-      

Taking shot in 3.. 2.. 1.. 0.
==>  Uploading your screenshot now...your screenshot can be viewed at http://imgur.com/HKIUznn
You can visit http://imgur.com/HKIUznn to see uploaded screenshot.

Say hello to linux_logo

The linux_logo program generates a color ANSI picture of a penguin which includes some system information obtained from the /proc filesystem.

Installation

Simply type the following command as per your Linux distro.

Debian/Ubutnu/Mint

$ sudo apt-get install linux_logo
OR
$ sudo apt-get install linuxlogo

CentOS/RHEL/Older Fedora

# yum install linux_logo

Fedora Linux v22+ or newer

# dnf install linux_logo

Run it

Simply type the following command:
$ linux_logo
linux_logo in action

But wait, there's more!

You can see a list of compiled in logos using:
$ linux_logo -f -L list
Sample outputs:
Available Built-in Logos:
 Num Type Ascii Name  Description
 1 Classic Yes aix  AIX Logo
 2 Banner Yes bsd_banner FreeBSD Logo
 3 Classic Yes bsd  FreeBSD Logo
 4 Classic Yes irix  Irix Logo
 5 Banner Yes openbsd_banner OpenBSD Logo
 6 Classic Yes openbsd  OpenBSD Logo
 7 Banner Yes solaris  The Default Banner Logos
 8 Banner Yes banner  The Default Banner Logo
 9 Banner Yes banner-simp Simplified Banner Logo
 10 Classic Yes classic  The Default Classic Logo
 11 Classic Yes classic-nodots The Classic Logo, No Periods
 12 Classic Yes classic-simp Classic No Dots Or Letters
 13 Classic Yes core  Core Linux Logo
 14 Banner Yes debian_banner_2 Debian Banner 2
 15 Banner Yes debian_banner Debian Banner (white)
 16 Classic Yes debian  Debian Swirl Logos
 17 Classic Yes debian_old Debian Old Penguin Logos
 18 Classic Yes gnu_linux Classic GNU/Linux
 19 Banner Yes mandrake Mandrakelinux(TM) Banner
 20 Banner Yes mandrake_banner Mandrake(TM) Linux Banner
 21 Banner Yes mandriva Mandriva(TM) Linux Banner
 22 Banner Yes pld  PLD Linux banner
 23 Classic Yes raspi  An ASCII Raspberry Pi logo
 24 Banner Yes redhat  RedHat Banner (white)
 25 Banner Yes slackware Slackware Logo
 26 Banner Yes sme  SME Server Banner Logo
 27 Banner Yes sourcemage_ban Source Mage GNU/Linux banner
 28 Banner Yes sourcemage Source Mage GNU/Linux large
 29 Banner Yes suse  SUSE Logo
 30 Banner Yes ubuntu  Ubuntu Logo

Do "linux_logo -L num" where num is from above to get the appropriate logo.
Remember to also use -a to get ascii version.
To see aix logo, enter:
$ linux_logo -f -L aix
To see openbsd logo:
$ linux_logo -f -L openbsd
Or just see some random Linux logo:
$ linux_logo -f -L random_xy
You can combine bash for loop as follows to display various logos, enter:
Gif 01: linux_logo and bash for loop for fun and profie

Getting help

Simply type the following command:
$ screenfetch -h
$ linux_logo -h

References

How to remove unused old kernel images on Ubuntu

http://ask.xmodulo.com/remove-kernel-images-ubuntu.html

Question: I have upgraded the kernel on my Ubuntu many times in the past. Now I would like to uninstall unused old kernel images to save some disk space. What is the easiest way to uninstall earlier versions of the Linux kernel on Ubuntu?
In Ubuntu environment, there are several ways for the kernel to get upgraded. On Ubuntu desktop, Software Updater allows you to check for and update to the latest kernel on a daily basis. On Ubuntu server, the unattended-upgrades package takes care of upgrading the kernel automatically as part of important security updates. Otherwise, you can manually upgrade the kernel using apt-get or aptitude command.
Over time, this ongoing kernel upgrade will leave you with a number of unused old kernel images accumulated on your system, wasting disk space. Each kernel image and associated modules/header files occupy 200-400MB of disk space, and so wasted space from unused kernel images will quickly add up.

GRUB boot manager maintains GRUB entries for each old kernel, in case you want to boot into it.

As part of disk cleaning, you can consider removing old kernel images if you haven't used them for a while.

How to Clean up Old Kernel Images

Before you remove old kernel images, remember that it is recommended to keep at least two kernel images (the latest one and an extra older version), in case the primary one goes wrong. That said, let's see how to uninstall old kernel images on Ubuntu platform.
In Ubuntu, kernel images consist of the following packages.
  • linux-image-: kernel image
  • linux-image-extra-: extra kernel modules
  • linux-headers-: kernel header files
First, check what kernel image(s) are installed on your system.
$ dpkg --list | grep linux-image
$ dpkg --list | grep linux-headers

Among the listed kernel images, you can remove a particular version (e.g., 3.19.0-15) as follows.
$ sudo apt-get purge linux-image-3.19.0-15
$ sudo apt-get purge linux-headers-3.19.0-15
The above commands will remove the kernel image, and its associated kernel modules and header files.
Note that removing an old kernel will automatically trigger the installation of the latest Linux kernel image if you haven't upgraded to it yet. Also, after the old kernel is removed, GRUB configuration will automatically be updated to remove the corresponding GRUB entry from GRUB menu.
If you have many unused kernels, you can remove multiple of them in one shot using the following shell expansion syntax. Note that this brace expansion will work only for bash or any compatible shells.
$ sudo apt-get purge linux-image-3.19.0-{18,20,21,25}
$ sudo apt-get purge linux-headers-3.19.0-{18,20,21,25}

The above command will remove 4 kernel images: 3.19.0-18, 3.19.0-20, 3.19.0-21 and 3.19.0-25.
If GRUB configuration is not properly updated for whatever reason after old kernels are removed, you can try to update GRUB configuration manually with update-grub2 command.
$ sudo update-grub2
Now reboot and verify that your GRUB menu has been properly cleaned up.

Sunday, September 13, 2015

5 open source alternatives to Gmail

http://opensource.com/life/15/9/open-source-alternatives-gmail

Image by : 
Judith E. Bell. Modified by Opensource.com. CC BY-SA 2.0.
Gmail has enjoyed phenomenal success, and regardless of which study you choose to look at for exact numbers, there's no doubt that Gmail is towards the top of the pack when it comes to market share. For certain circles, Gmail has become synonymous with email, or at least with webmail. Many appreciate its clean interface and the simple ability to access their inbox from anywhere.
But Gmail is far from the only name in the game when it comes to web-based email clients. In fact, there are a number of open source alternatives available for those who want more freedom, and occasionally, a completely different approach to managing their email without relying on a desktop client.
Let's take a look at just a few of the free, open source webmail clients out there available for you to choose from.

Roundcube

First up on the list is Roundcube. Roundcub is a modern webmail client which will install easily on a standard LAMP (Linux, Apache, MySQL, and PHP) stack. It features a drag-and-drop interface which generally feels modern and fast, and comes with a slew of features: canned responses, spell checking, translation into over 70 languages, a templating system, tight address book integration, and many more. It also features a pluggable API for creating extensions.
It comes with a comprehensive search tool, and a number of features on the roadmap, from calendaring to a mobile UI to conversation view, all sound promising, but at the moment these missing features do hold it back a bit compared to some other options.
Roundcube is available as open source under the GPLv3.
Roundcube
Roundcube screenshot courtesy of the project's website.

Zimbra

The next client on the list is Zimbra, which I have used extensively for work. Zimbra includes both a webmail client and an email server, so if you’re looking for an all-in-one solution, it may be a good choice.
Zimbra is a well maintained project which has been hosted at a number of different corporate entities through the years, most recently being acquired by a company called Synacore, last month. It features most of the things you’ve come to expect in a modern webmail client, from webmail to folders to contact lists to a number of pluggable extensions, and generally works very well. I have to admit that I'm most familiar with an older version of Zimbra which felt at times slow and clunky, especially on mobile, but it appears that more recent versions have overcome these issues and provide a snappy, clean interface regardless of the device you are using. A desktop client is also available for those who prefer a more native experience. For more on Zimbra, see this article from from Zimbra's Olivier Thierry who shares a good deal more about Zimbra's role in the open source community.
Zimbra's web client is licensed under a Common Public Attribution License, and the server code is available under GPLv2.
Zimbra
Zimbra screenshot courtesy of Clemente under the GNU Free Documentation License.

SquirrelMail

I have to admit, SquirrelMail (self-described as "webmail for nuts") does not have all of the bells and whistles of some more modern email clients, but it’s simple to install and use and therefore has been my go-to webmail tool for many years as I’ve set up various websites and needed a mail client that was easy and "just works." As I am no longer doing client work and shifted towards using forwarders instead of dedicated email accounts for personal projects, I realized it had been awhile since I took a look at SquirrelMail. For better or for worse, it’s exactly where I left it.
SquirrelMail started in 1999 as an early entry into the field of webmail clients, with a focus on low resource consumption on both the server and client side. It requires little in the way of special extensions of technologies to be used, which back in the time it was created was quite important, as browsers had not yet standardized in the way we expect them to be by today’s standards. The flip side of its somewhat dated interface is that it has been tested and used in production environments for many years, and is a good choice for someone who wants a webmail client with few frills but few headaches to administer.
SquirrelMail is written in PHP and is licensed under the GPL.
SquirrelMail
SquirrelMail screenshot courtesy of the project website.

Rainloop

Next up is Rainloop. Rainloop is a very modern entry into the webmail arena, and its interface is definitely closer to what you might expect if you're used to Gmail or another commercial email client. It comes with most features you've come to expect, including email address autocompletion, drag-and-drop and keyboard interfaces, filtering support, and many others, and can easily be extended with additional plugins. It integrates with other online accounts like Facebook, Twitter, Google, and Dropbox for a more connected experience, and it also renders HTML emails very well compared to some other clients I've used, which can struggle with complex markup.
It's easy to install, and you can try Rainloop in an online demo to decide if it's a good fit for you.
Rainloop is primarily written in PHP, and the community edition is licensed under the AGPL. You can also check out the source code on GitHub.
Rainloop
Rainloop screenshot by author.

Kite

The next webmail client we look at is Kite, which unlike some of the other webmail clients on our list was designed to go head-to-head with Gmail, and you might even consider it a Gmail clone. While Kite hasn't fully implemented all of Gmail's many features, you will instantly be familiar with the interface. It's easy to test it out with Vagrant in a virtual machine out of the box.
Unfortunately, development on Kite seems to have stalled about a year ago, and no new updates have been made to the project since. However, it's still worth checking out, and perhaps someone will pick up the project and run with it.
Kite is written in Python and is licensed under a BSD license. You can check out the source code on GitHub.

More options

  • HastyMail is an older email client, originating back in 2002, which is written in PHP and GPL-licensed. While no longer maintained, the project's creators have gone on to a new webmail project, Cypht, which also looks promising.
  • Mailpile is an HTML 5 email client, written in Python and available under the AGPL. Currently in beta, Mailpile has a focus on speed and privacy.
  • WebMail Lite is a modern but minimalist option, licensed under the AGPL and written mostly in PHP.
  • There are also a number of groupware solutions, such as Horde, which provide webmail in addition to other collaboration tools.
This is by no means a comprehensive list. What's your favorite open source webmail client?

WiFi Without Network Manager Frippery

http://freedompenguin.com/articles/networking/wifi-without-network-manager-frippery

Back in my day, sonny…there was a time when you could make your networking work without the network manager applet. Not that I’m saying the NetworkManager program is bad, because it actually has been getting better. But the fact of the matter is that I’m a networking guy and a server guy, so I need keep my config-file wits sharp. So take out your pocket knife and let’s start to whittle.
Begin by learning and making some notes about your interfaces before you start to turn off NetworkManager. You’ll need to write down these 3 things:
1) Your SSID and passphrase.
2) The names of your Ethernet and radio devices. They might look like wlan0, wifi0, eth0 or enp2p1.
3) Your gateway IP address.
Next, we’ll start to monkey around in the command line… I’ll do this with Ubuntu in mind.
So, let’s list our interfaces:
  1. $ ip a show
Note the default Ethernet and wifi interfaces:
ip-a-show
It looks like our Ethernet port is eth0. Our WiFi radio is wlan0. Want to make this briefer?
  1. $ ip a show | awk '/^[0-9]: /{print $2}'
The output of this command will look something like this:
lo:
eth0:
wlan0:
Your gateway IP address is found with:
  1. route -n
It provides access to destination 0.0.0.0 (everything). In the below image it is 192.168.0.1, which is perfectly nominal.
route-n
Let’s do a bit of easy configuration in our /etc/networking/interfaces file. The format of this file is not difficult to put together from the man page, but really, you should search for examples first.
interfaces
Plug in your Ethernet port.
Basically, we’re just adding DHCP entries for our interfaces. Above you’ll see a route to another network that appears when I get a DHCP lease on my Ethernet port. Next, add this:

  1. auto lo
  2. iface lo inet loopback
  3. auto eth0
  4. iface eth0 inet dhcp
  5. auto wlan0
  6. iface wlan0 inet dhcp

To be honest, that’s probably all you will ever need. Next, enable and start the networking service:
  1. sudo update-rc.d networking enable

  1. sudo /etc/init.d/networking start
Let’s make sure this works, by resetting the port with these commands:
  1. sudo ifdown eth0

  1. sudo ip a flush eth0

  1. sudo ifup eth0
This downs the interface, flushes the address assignment to it, and then brings it up. Test it out by pinging your gateway IP: ping 192.168.0.1. If you don’t get a response, your interface is not connected or your made a typo.
Let’s “do some WiFi” next! We want to make an /etc/wpa_supplicant.conf file. Consider mine:
  1. network={
  2. ssid="CenturyLink7851"
  3. scan_ssid=1
  4. key_mgmt=WPA-PSK
  5. psk="4f-------------ac"
  6. }
Now we can reset the WiFi interface and put this to work:
  1. sudo ifdown wlan0

  1. sudo ip a flush wlan0

  1. sudo ifup wlan0

  1. sudo wpa_supplicant -Dnl80211 -c /root/wpa_supplicant.conf -iwlan0 -B

  1. sudo dhclient wlan0
That should do it. Use a ping to find out, and do it explicitly from wlan0, so it gets it’s address first:

  1. $ ip a show wlan0 | grep "inet"
192.168.0.45
  1. $ ping -I 192.168.0.45 192.168.0.1
Presumably dhclient updated your /etc/resolv.conf, so you can also do a:
  1. ping -I 192.168.0.45 www.yahoo.com
Well guess what – you’re now running without NetworkManager!

Saturday, September 12, 2015

How to monitor OpenStack deployments with Docker, Graphite, Grafana, collectd and Chef

http://superuser.openstack.org/articles/how-to-monitor-openstack-deployments-with-docker-graphite-grafana-collectd-and-chef

I was considering making this a part of the "Monitoring UrbanCode Deployments with Docker, Graphite, Grafana, collectd and Chef!" series but as I didn't include this in the original architecture so it would be more to consider this an addendum. In reality, it's probably more of a fork as I'll may continue with future blog postings about the architecture herein.
One of the issues I ran into right away while deploying the monitoring solution described in the above post was an internal topology managed by UrbanCode Deploy whereby each of the agent host machines had quirks and issues that required me to constantly tweak the monitoring install process. (Fixing yum and apt-get repositories, removing conflicts, installing unexpectedly missing libraries, conflicting JDKs.) The reason for this? Each machine was installed by different people who installed the operating systems and the UrbanCode Deploy Agent in different ways with different options. It would have been great if all nodes were consistent and it would have made my life much easier.
It was at this point that my colleague Michael told me that I should create a blueprint in UrbanCode Deploy for the topology I want to deploy the monitoring solution into for testing.
Here's Michael doing a quick demo of UrbanCode Deploy Blueprint Designer, also known as UrbanCode Deploy with Patterns in the video below:
Fantastic, now I can create a blueprint of the desired topology, add a monitoring component to the nodes that I wish to have monitored and presto! Here is what the blueprint looks like in UrbanCode Deploy Blueprint Designer:
alt text here
I created three nodes with three different operating systems just to show off that this solution works on different operating systems. (It also works on RHEL 7 but I thought adding another node would be overdoing it a little as well as cramming my already overcrowded RSA sketches).
This blueprint is actually a Heat Orchestration Template (HOT). You can see the source code here: https://hub.jazz.net/git/kuschel/monitorucd/contents/master/Monitoring/Monitoring.yaml
So, if we modify the original Installation in Monitoring UrbanCode Deployments with Docker, Graphite, Grafana, collectd and Chef! Part 1, it would look something like this:
alt text here
We don't have any UrbanCode Deploy agents installed as the agent install is incorporated as part of the blueprint. You can see this in the yaml under the resources identified by ucd_agent_install_linux and ucd_agent_install_win. You'll see some bash or powershell scripting that installs the UrbanCode Agent as part of the virtual machine initialization.
You'll also see the IBM::UrbanCode::SoftwareDeploy::UCD, IBM::UrbanCode::SoftwareConfig::UCD and IBM::UrbanCode::ResourceTree resource types which allow the Heat engine to deploy create resources in UrbanCode Deploy and ensure that component processes are executed are installed into the virtual machines, once the UrbanCode Deploy agents are installed and started.
Ok, let's take a time out and talk a little about how this all works. First, what's Heat? Heat is an orchestration engine that is able to call cloud provider APIs (and other necessary APIs) to actualize the resources that are specified in yaml into a cloud environment. Heat is part of the OpenStack project so it natively supports OpenStack Clouds but can also work with Amazon Web Services, IBM SoftLayer or any other cloud provider that is compliant with the OpenStack interfaces required to create virtual machines, virtual networks, etc.
In addition, Heat can be extended with other resource types like those for UrbanCode Deploy components that allows them to be deployed into environments provisioned by OpenStack via Heat using the Heat Orchestration Template (HOT) specified during a provisioning.
The UrbanCode Deploy Blueprint Designer provides a kick ass visual editor and a simple way to drag drop UrbanCode Deploy Components into Heat Orchestration Templates (HOT). It also provides the ability to connect to a cloud provider (OpenStack, AWS and IBM SoftLayer are currently supported) and deploy the HOT. You can monitor the deployment progress. Oh, it also uses Git as a source for the HOTs (yaml) so that makes it super easy to version and share blueprints.
Ok, let's go over the steps on how to install it. I assume you have UrbanCode Deploy installed and configured with UrbanCode Deploy Blueprint Designer and connected to an OpenStack cloud. You can set up a quick cloud using DevStack.
You'll also need to install the Chef plugin from here: https://developer.ibm.com/urbancode/plugin/chef. Import the application from IBM BlueMix DevOps Service Git found here: https://hub.jazz.net/git/kuschel/monitorucd/contents/master/Monitored_app.json Import it from the "applications" tab:
alt text here
Use the default options in the import dialog. After, you should now see it listed in applications as "monitored." There will also be a new component in the "components" tab called monitoring:
alt text here
I have made the Git repository public so the component is already configured to to to the IBM BlueMix DevOps Service Git and pull the recipe periodically and create a new version, you may change this behaviour in Basic Settings by unchecking the Import Versions Automatically setting.
You'll have to fix up the imported process a little as I had to remove the encrypted fields to allow easier import. Go to components->monitoring->processes-Install and edit the install collectd step:
alt text here
alt text here
In the collectd password field put. You will see bullets, that's OK. Copy/paste (and no spaces!):
${p:environment/monitoring.password}
We need a metrics collector to store the metrics and a graphing engine to visualize them. We'll be using a Docker image of Graphite/Grafana/Collectd I put together. You will need to ability to build run a docker container either using boot2docker or the native support available in Linux I have put the image up on the public docker registry as bkuschel/graphite-grafana-collectd but you can also build it from the Dockerfile in IBM BlueMix DebOps Services's Git at https://hub.jazz.net/git/kuschel/monitorucd/contents/master/DockerWithCollectd/Dockerfile To get the image run:
docker pull bkuschel/graphite-grafana-collect
Now run the image and bind the ports 80, 2003 and udp port 2 from the docker container to the hosts ports.
docker run -p 80:80 -p 2003:2003 -p 25826:25826/udp -t bkuschel/graphite-grafana-collectd
You can also mount file volumes to the container that contains the collector's database, if you wish that to be persisted. Each time you restart the container, it contains a fresh database. This has its advantages for testing. You can also specify other configurations beyond what are provided as defaults. Look at the Dockerfile for the volumes. You'll need to connect the UrbanCode Blueprint Designer to Git by adding https://hub.jazz.net/git/kuschel/monitorucd to the repositories
alt text here
You should now see monitoring in the list of blueprints on the UrbanCode Deploy Blueprint Designer Home Page. Click on it to open the blueprint.
I am not going to cover the UrbanCode Component Processes as they are essentially the same the ones I described in Monitoring UrbanCode Deployments with Docker, Graphite, Grafana, collectd and Chef! (Part 2: The UCD Process) and Interlude #2: UCD Monitoring with Windows Performance Monitor and JMXTrans. The processes have been reworked to be executable using the application/component processes rather then solely from Resource Processes (generic). I also added some steps that do fix of typical problems in OpenStack images, such as fixing the repository and a workaround for a host name issue causing JMX not to bind properly.
The blueprint is also rudimentary and it may need to be tweaked to conform to the specific cloud set up in your environment. I created three virtual machines for Operating System images I happened to have available on my OpenStack, hooked them together on the private network and gave them external IPs so that I can access them. They all have the monitoring component added to them and should be deployed into the Monitored Application.
Once you've fixed everything up, make sure you select a cloud and then click "provision:"
alt text here
It will now ask for launch configuration parameters, again, many of these will be specific to you environment but you should be able to leave everything as is.
alt text here
If you bound the Docker container to other different ports you'll have to change the port numbers for graphite (2003) and Docker (25826). You will need to set the admin password to something recognizable, it's the Windows administrator password. You may or may not need this depending on how your Windows image is set up. (I needed it.) The monitoring/server is the Public IP address of your Docker host running the bkuschel/graphite-grafana-collectd image. The monitoring/password is the one the is built into the Docker image. You will need to modify the Docker image to either not hard code this value or build a new image with a different password.
Once "provision" is clicked, something like this should happen: alt text here
click to enlarge:
The monitoring.yaml(originating from Git) in UrbanCode Deploy Blueprint is passed to the heat engine on provisioning, with all parameters bound. The heat engine creates an UrbanCode Deploy Environment in the application specified in yaml (this can be changed) The UrbanCode Deploy Environment is mapped to the UrbanCode Deploy Component as specified in the yaml resource It also creates UrbanCode Deploy resources that will be used to represent the UrbanCode Deploy agents once they come online The agent resources are mapped to the environment. Heat interacts with the cloud provider (OpenStack in this case) to deploy the virtual machines specified in the yaml. The virtual machines are created and the agents installed as part of virtual machine intialization ("user data.") Once the agents come online the component process is run The component process will be run for each resource mapped to the environment The component process runs the generic process Install_collectd_process (or Install_perfmon_process for Windows) on each agent. The agent installs collectd or GraphitePowershellFunctions via Chef and performs other process steps as required to get the monitoring solution deployed.
The progress can be monitored in UrbanCode Deploy Blueprint Designer:
alt text here
(Click here for larger version.)
Once the process is finished, the new topology should look something like this:
alt text here
(For larger version, click here.)
That should be it, give it a shot. Once you've got it working, the results are quite impressive. Here are some Grafana performance dashboards for CPU and Heap based on the environment I deployed using this method. The three Monitoring_Monitoring_ correspond to :
alt text here
(For larger version, click here.)

Friday, September 11, 2015

Linux Server See the Historical and Statistical Uptime of System With tuptime Utility

http://www.cyberciti.biz/hardware/howto-see-historical-statistical-uptime-on-linux-server

You can use the following tools to see how long system has been running on a Linux or Unix-like system:
  • uptime : Tell how long the server has been running.
  • lastt : Show the reboot and shutdown time.
  • tuptime : Report the historical and statistical running time of system, keeping it between restarts. Like uptime command but with more interesting output.

Finding out the system last reboot time and date

You can use the following commands to get the last reboot and shutdown time and date on a Linux operating system (also works on OSX/Unix-like system):
## Just show  system reboot and shutdown date and time ###
who -b
last reboot
last shutdown
## Uptime info ##
uptime
cat /proc/uptime
awk '{ print "up " $1 /60 " minutes"}' /proc/uptime
w
 
Sample outputs:
Fig.01: Various Linux commands in action to find out the server uptime

Say hello to tuptime

The tuptime command line tool can report the following information on a Linux based system:
  1. Count system startups
  2. Register first boot time (a.k.a. installation time)
  3. Count nicely and accidentally shutdowns
  4. Average uptime and downtime
  5. Current uptime
  6. Uptime and downtime rate since first boot time
  7. Accumulated system uptime, downtime and total
  8. Report each startup, uptime, shutdown and downtime

Installation

Type the following command to clone a git repo on a Linux operating system:
$ cd /tmp
$ git clone https://github.com/rfrail3/tuptime.git
$ ls
$ cd tuptime
$ ls

Sample outputs:
Fig.02: Cloning a git repo

Make sure you've Python v2.7 installed with sys, optparse, os, re, string, sqlite3, datetime, disutils, and locale modules.
You can simply install it as follows:
$ sudo tuptime-install.sh
OR do a manual installation (recommended method due to systemd or non-systemd based Linux system):
$ sudo cp /tmp/tuptime/latest/cron.d/tuptime /etc/cron.d/tuptime
If is a system with systemd, copy service file and enable it:
$ sudo cp /tmp/tuptime/latest/systemd/tuptime.service /lib/systemd/system/
$ sudo systemctl enable tuptime.service

If the systemd don't have systemd, copy init file:
$ sudo cp /tmp/tuptime/latest/init.d/tuptime.init.d-debian7 /etc/init.d/tuptime
$ sudo update-rc.d tuptime defaults

Run it

Simply type the following command:
$ sudo tuptime
Sample outputs:
Fig.03: tuptime in action

After kernel upgrade I rebooted the box and typed the same command again:
$ sudo tuptime
System startups: 2   since   03:52:16 PM 08/21/2015
System shutdowns: 1 ok   -   0 bad
Average uptime:  7 days, 16 hours, 48 minutes and 3 seconds
Average downtime:  2 hours, 30 minutes and 5 seconds
Current uptime:  5 minutes and 28 seconds   since   06:23:06 AM 09/06/2015
Uptime rate:   98.66 %
Downtime rate:   1.34 %
System uptime:   15 days, 9 hours, 36 minutes and 7 seconds
System downtime:  5 hours, 0 minutes and 11 seconds
System life:   15 days, 14 hours, 36 minutes and 18 seconds
You can change date and time format as follows:
$ sudo tuptime -d '%H:%M:%S %m-%d-%Y'
Sample outputs:
System startups: 1   since   15:52:16 08-21-2015
System shutdowns: 0 ok   -   0 bad
Average uptime:  15 days, 9 hours, 21 minutes and 19 seconds
Average downtime:  0 seconds
Current uptime:  15 days, 9 hours, 21 minutes and 19 seconds   since   15:52:16 08-21-2015
Uptime rate:   100.0 %
Downtime rate:   0.0 %
System uptime:   15 days, 9 hours, 21 minutes and 19 seconds
System downtime:  0 seconds
System life:   15 days, 9 hours, 21 minutes and 19 seconds
Enumerate each startup, uptime, shutdown and downtime:
$ sudo tuptime -e
Sample outputs:
Startup:  1  at  03:52:16 PM 08/21/2015
Uptime:   15 days, 9 hours, 22 minutes and 33 seconds
 
System startups: 1   since   03:52:16 PM 08/21/2015
System shutdowns: 0 ok   -   0 bad
Average uptime:  15 days, 9 hours, 22 minutes and 33 seconds
Average downtime:  0 seconds
Current uptime:  15 days, 9 hours, 22 minutes and 33 seconds   since   03:52:16 PM 08/21/2015
Uptime rate:   100.0 %
Downtime rate:   0.0 %
System uptime:   15 days, 9 hours, 22 minutes and 33 seconds
System downtime:  0 seconds
System life:   15 days, 9 hours, 22 minutes and 33 seconds