http://xmodulo.com/2014/05/web-based-lightweight-system-monitor-linux.html
Sometimes we, as a normal user or a system admin, need to know how well our system is running. Many questions related to system status can be answered by checking log files generated by active services. However, inspecting every bit of log files is not easy even for seasoned system admins. That is why they rely on monitoring software which is capable of gathering information from different sources, and reporting analysis result in easy to understand formats, such as graphs, visualization, statistics, etc.
There are many sophisticated monitoring system software such as Cacti, Nagios, Zabbix, Munin, etc. In this article, we pick a lightweight monitoring tool called Monitorix, which is designed to monitor system resources and many well-known third-party applications on Linux/BSD servers. Optimized to run on resource-limited embedded systems, Monitorix boasts of simplicity and small memory footprint. It comes with a built-in HTTP server for web-based interface, and stores time series statistics with RRDtool which is easy to combine with any scripting language such as Perl, Python, shell script, Ruby, etc.
By default, the built-in HTTP server listens on port 8080. Thus, make sure that your firewall does not block TCP port 8080.
To start Monitorix, simply type the following.
:8080/monitorix to access Monitorix's web
interface.
By default, the built-in HTTP server is disabled on Archlinux. To enable built-in HTTP server, edit section in
/etc/monitorix.conf as follows.
Finally, start Monitorix service.
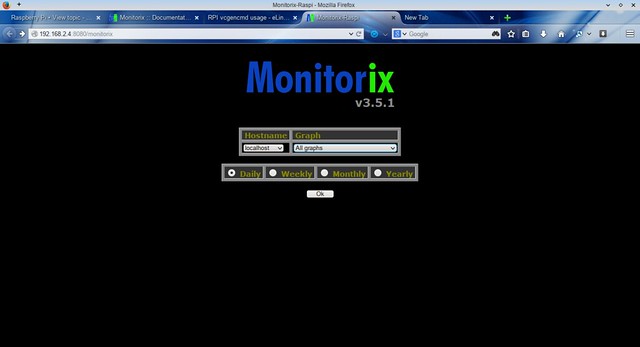
Open your favorite web browser, and go to http://:8080/monitorix to access Monitorix.
8080/monitorix on your favorite web
browser.
First, install required packages.
Install Monitorix package with the command below.
Open /etc/monitorix/monitorix.conf with your favorite text editor. Scroll down until you find. Search for
"raspberrypi = n", and replace 'n' with 'y'. This will enable
monitoring of Raspberry Pi clock frequency, temperatures and voltages.
After editing is done, restart Monitorix service.
:8080/monitorix
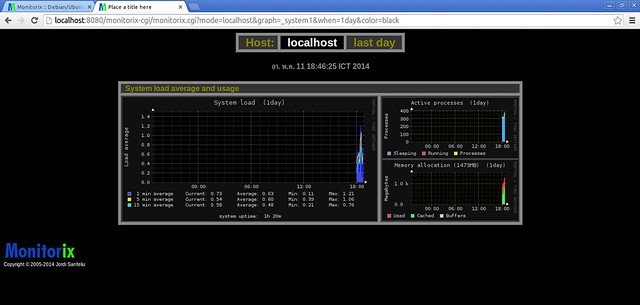
System load average and usage in graph option:
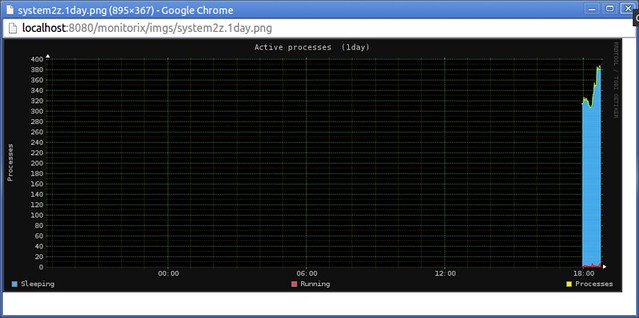
Active process graph option:
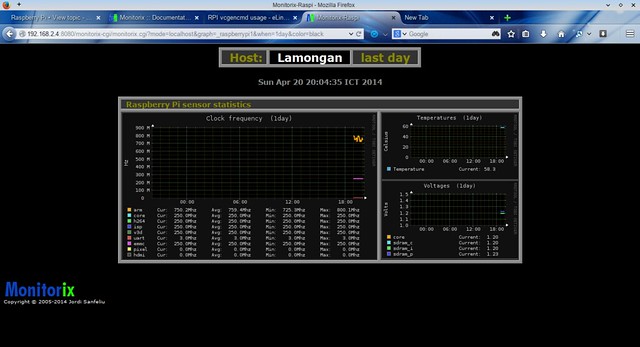
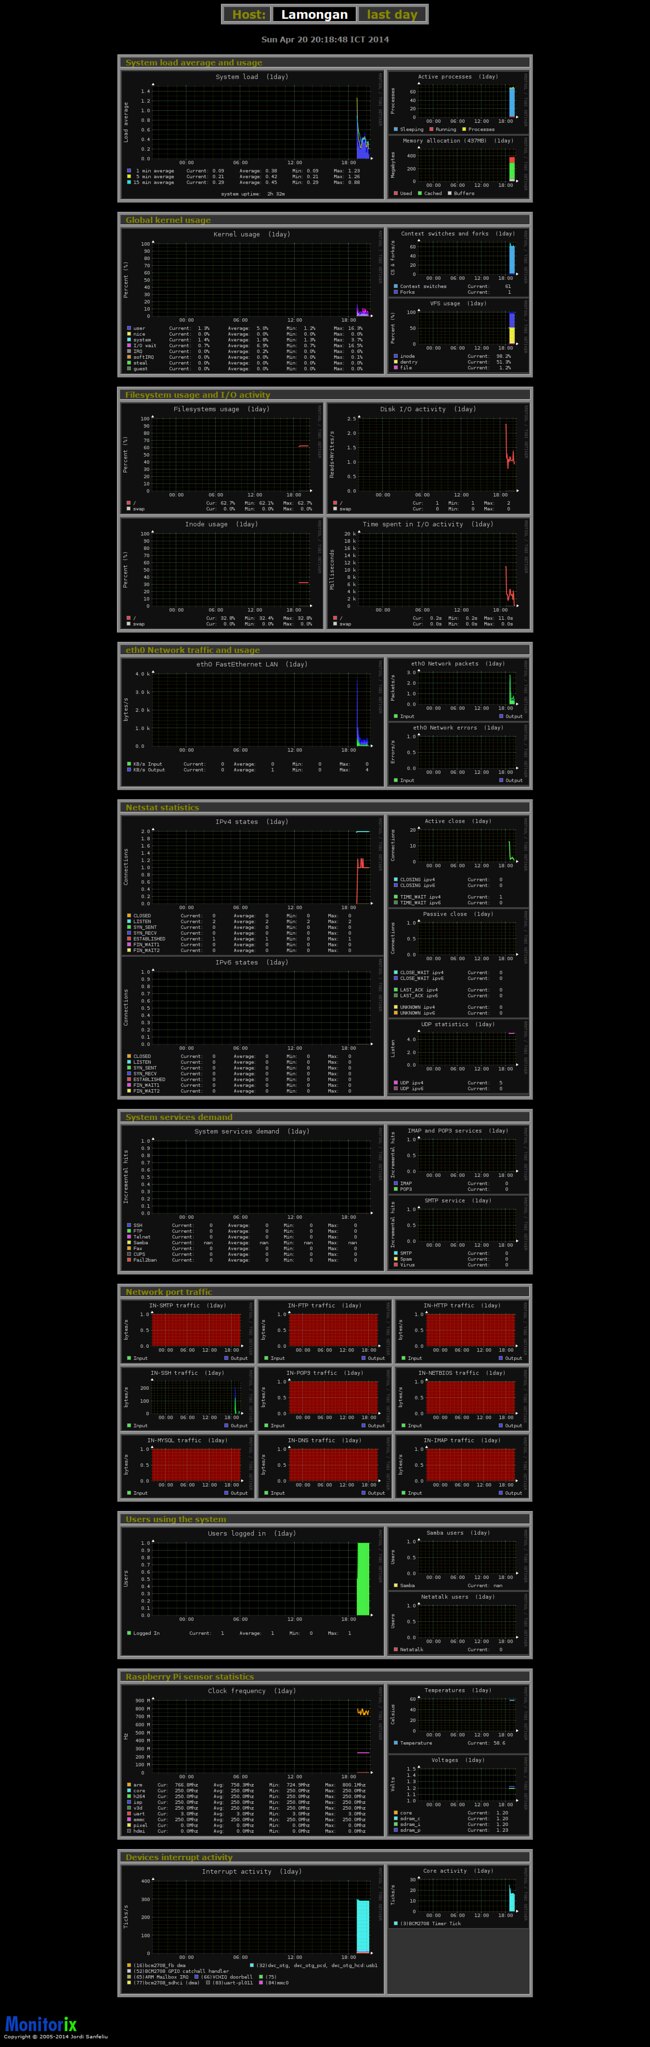
Choose "Clock Frequency" under "Raspberry Pi" section in the home screen, and you will see clock frequency, temperature, and voltage graphs for Raspberry Pi.
All monitoring graphs:
Sometimes we, as a normal user or a system admin, need to know how well our system is running. Many questions related to system status can be answered by checking log files generated by active services. However, inspecting every bit of log files is not easy even for seasoned system admins. That is why they rely on monitoring software which is capable of gathering information from different sources, and reporting analysis result in easy to understand formats, such as graphs, visualization, statistics, etc.
There are many sophisticated monitoring system software such as Cacti, Nagios, Zabbix, Munin, etc. In this article, we pick a lightweight monitoring tool called Monitorix, which is designed to monitor system resources and many well-known third-party applications on Linux/BSD servers. Optimized to run on resource-limited embedded systems, Monitorix boasts of simplicity and small memory footprint. It comes with a built-in HTTP server for web-based interface, and stores time series statistics with RRDtool which is easy to combine with any scripting language such as Perl, Python, shell script, Ruby, etc.
Main Features
Here is a list of Monitorix's main features. For a complete list, refer to the official site.- System load and system service demand
- CPU/GPU temperature sensors
- Disk temperature and health
- Network/port traffic and netstat statistics
- Mail statistics
- Web server statistics (Apache, Nginx, Lighttpd)
- MySQL load and statistics
- Squid proxy statistics
- NFS server/client statistics
- Raspberry Pi sensor statistics
- Memcached statistics
Install and Configure Monitorix on Fedora, CentOS or RHEL
First, install required packages as follows. Note that on CentOS, you need to set up EPEL and Repoforge repositories first.
$ sudo yum install rrdtool rrdtool-perl perl-libwww-perl perl-MailTools
perl-MIME-Lite perl-CGI perl-DBI perl-XML-Simple perl-Config-General
perl-HTTP-Server-Simple perl-IO-Socket-SSL
After this, Monitorix can be installed with this command:
$ sudo yum install monitorix
To configure Monitorix, open the configuration file in
/etc/monitorix/monitorix.conf, and change the options. The details on
Monitorix configuration file can be found at http://www.monitorix.org/documentation.htmlBy default, the built-in HTTP server listens on port 8080. Thus, make sure that your firewall does not block TCP port 8080.
To start Monitorix, simply type the following.
$ sudo service monitorix start
Start your favorite web browser, and then go to
http://Install and Configure Monitorix on Archlinux
On Archlinux, the Monitorix package can be downloaded from AUR.By default, the built-in HTTP server is disabled on Archlinux. To enable built-in HTTP server, edit
1
2
3
4
5
6
7
8
9
10
11
12
13
14
15
| enabled = y host = port = 8080 user = nobody group = nobody log_file = /var/log/monitorix-httpd hosts_deny = hosts_allow = enabled = n msg = Monitorix: Restricted access htpasswd = /var/lib/monitorix/htpasswd </auth></httpd_builtin> |
Open your favorite web browser, and go to http://
Install and Configure Monitorix on Debian and Ubuntu
For Debian family, Monitorix can be installed in two ways: manually or through a third party repository.Manual installation (for Debian)
Install all dependent packages first.
$ sudo apt-get install rrdtool perl libwww-perl libmailtools-perl
libmime-lite-perl librrds-perl libdbi-perl libxml-simple-perl
libhttp-server-simple-perl libconfig-general-perl libio-socket-ssl-perl
Download Monitorix package from http://www.monitorix.org/downloads.html, and install it.
$ sudo dpkg -i monitorix*.deb
During installation, you might be asked to configure a backend web
server. If you using Apache, make sure to reload Apache configuration by
restarting Apache service.
$ sudo service apache2 reload
Installation through repositories (for Ubuntu)
Enable Izzysoft repository by appending the following line in /etc/apt/source.list.deb http://apt.izzysoft.de/ubuntu generic universeDownload and add a GPG key for the repository.
$ wget http://apt.izzysoft.de/izzysoft.asc
$ sudo apt-key add izzysoft.asc
Install Monitorix with apt-get. All its dependent packages will automatically be installed as well.$ sudo apt-key add izzysoft.asc
$ sudo apt-get update
$ sudo apt-get install monitorix
Finally, start Monitorix service.$ sudo apt-get install monitorix
$ sudo service monitorix start
To configure Monitorix, edit /etc/monitorix/monitorix.conf with a text editor, and restart Monitorix service.
$ sudo service monitorix restart
The built-in web server of Monitorix for Ubuntu is enabled by
default. To access web-based monitoring result, go to
http://Install and Configure Monitorix on Raspberry Pi
If you want to install Monitorix on Raspberry Pi (which is Debian-based), you cannot use the Izzysoft repository mentioned above because it does not provide an ARM port of Monitorix. Instead, follow Debian-based manual installation as follows.First, install required packages.
$ sudo apt-get install rrdtool perl libwww-perl libmailtools-perl
libmime-lite-perl librrds-perl libdbi-perl libxml-simple-perl
libhttp-server-simple-perl libconfig-general-perl libio-socket-ssl-perl
If some of the required packages are not be installed, we need to force install with this command.
$ sudo apt-get -f install
Download Monitorix package (monitorix_x.x.x-izzy1_all.deb) from http://www.monitorix.org/downloads.html.Install Monitorix package with the command below.
$ sudo dpkg -i monitorix_x.x.x-izzy1_all.deb
After installation is finished, we need to change a small thing in Monitorix configuration as follows.Open /etc/monitorix/monitorix.conf with your favorite text editor. Scroll down until you find
After editing is done, restart Monitorix service.
$ sudo service monitorix restart
By default, Monitorix's built-in HTTP web server is enabled. To
access Monitorix's web interface, go to
http://Monitorix Screenshots (on Raspberry Pi)
Monitorix home screen:System load average and usage in graph option:
Active process graph option:
Choose "Clock Frequency" under "Raspberry Pi" section in the home screen, and you will see clock frequency, temperature, and voltage graphs for Raspberry Pi.
All monitoring graphs:

No comments:
Post a Comment