http://xmodulo.com/visualize-memory-usage-linux.html
Lack of sufficient physical memory can significantly hamper the performance of Linux desktop and server environments. When your desktop is sluggish, one of the first things to do is to free up RAMs. Memory usage is even more critical in multi-user shared hosting or mission-critical server environments, where different users or application threads constantly compete for more memory.
When it comes to monitoring any type of system resources such as memory or CPUs, visualization is an effective means to help understand quickly how they are consumed by different processes and users. In this tutorial, I describe how to visualize memory usage in Linux environment using a command-line tool called smem.
Resident set size (RSS), reported by top command, is one popular metric which captures what portion of a process' reported memory is residing in RAM. However, aggregating RSS of existing processes can easily overestimate the overall physical memory usage of the Linux system because the same physical memory page can be shared by different processes. Proportional set size (PSS) is a more accurate measurement of effective memory usage of Linux processes since PSS properly discounts the memory page shared by more than one process. Unique set size (USS) of a process is a subset of the process' PSS, which is not shared by any other processes.
If you want to check the overall system memory usage for all users, run smem as the root.
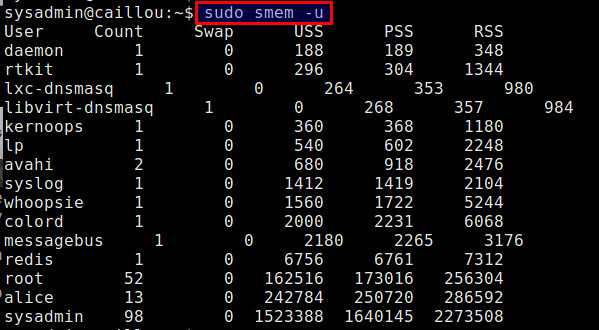
To view per-user memory usage:
smem allows you to filter memory usage results based on mapping, processes or users in the following format:
Here are examples of memory usage visualization.
The following command will generate a bar graph that visualizes the PSS/USS memory usage of a user alice.
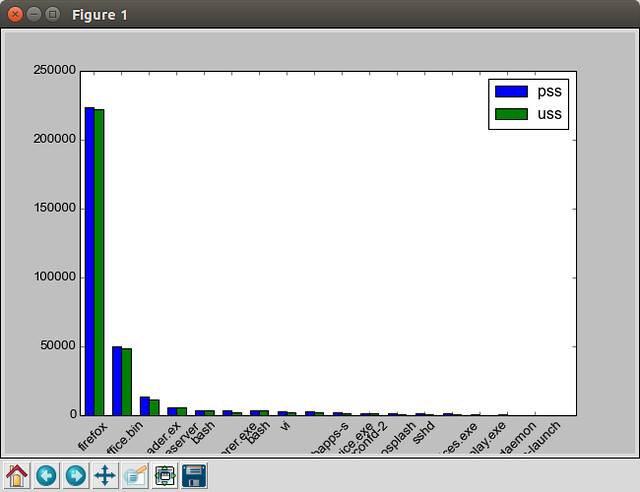
The next command will plot a pie graph of the overall PSS memory usage of different processes.
As a summary, smem is a simple and effective memory analysis tool that comes in handy in various circumstances. Using its formatted output, you can run smem to identify any memory issues and take an action in an automatic fashion. If you know of any good memory monitoring tool, share it in the comment.
Lack of sufficient physical memory can significantly hamper the performance of Linux desktop and server environments. When your desktop is sluggish, one of the first things to do is to free up RAMs. Memory usage is even more critical in multi-user shared hosting or mission-critical server environments, where different users or application threads constantly compete for more memory.
When it comes to monitoring any type of system resources such as memory or CPUs, visualization is an effective means to help understand quickly how they are consumed by different processes and users. In this tutorial, I describe how to visualize memory usage in Linux environment using a command-line tool called smem.
Physical Memory Usage: RSS vs. PSS vs. USS
In the presence of virtual memory abstraction, accurately quantifying physical memory usage of a process is actually not straightforward. The virtual memory size of a process is not meaningful because it does not tell how much of it is actually allocated physical memory.Resident set size (RSS), reported by top command, is one popular metric which captures what portion of a process' reported memory is residing in RAM. However, aggregating RSS of existing processes can easily overestimate the overall physical memory usage of the Linux system because the same physical memory page can be shared by different processes. Proportional set size (PSS) is a more accurate measurement of effective memory usage of Linux processes since PSS properly discounts the memory page shared by more than one process. Unique set size (USS) of a process is a subset of the process' PSS, which is not shared by any other processes.
Install Smem on Linux
The command-line tool smem can generate a variety of reports related to memory PSS/USS usage by pulling information from /proc. It comes with built-in graphical chart generation capabilities, so one can easily visualize overall memory consumption status.Install Smem on Debian or Ubuntu
$ sudo apt-get install smem
Install Smem on Linux Mint
$ sudo apt-get install smem python-matplotlib python-tk
Install Smem on Fedora or CentOS/RHEL
On CentOS/RHEL, you need to enable EPEL repository first.
$ sudo yum install smem python-matplotlib
Check Memory Usage with Smem
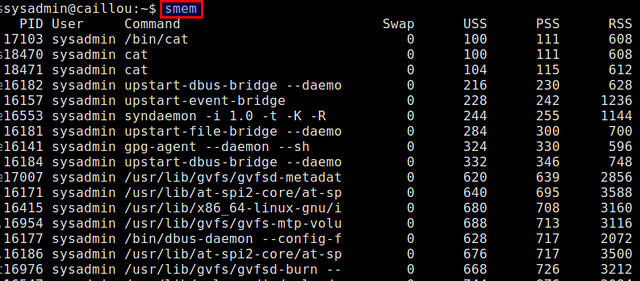
When you run smem as a unprivileged user, it will report physical memory usage of every process launched by the current user, in an increasing order of PSS.
$ smem
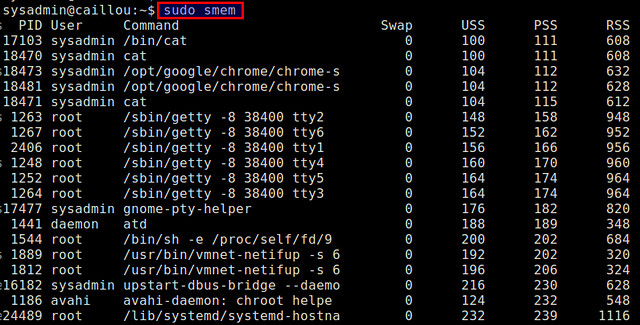
If you want to check the overall system memory usage for all users, run smem as the root.
$ sudo smem
$ sudo smem -u
smem allows you to filter memory usage results based on mapping, processes or users in the following format:
- -M
- -P
- -U
Visualize Memory Usage with Smem
Visualized reports are often easier to read to identify the memory hogs of your system quickly. smem supports two kinds of graphical reports for memory usage visualization: bar and pie graphs.Here are examples of memory usage visualization.
The following command will generate a bar graph that visualizes the PSS/USS memory usage of a user alice.
$ sudo smem --bar name -c "pss uss" -U alice
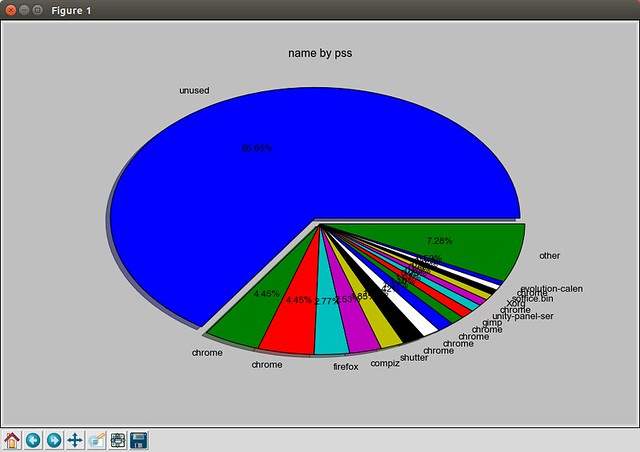
The next command will plot a pie graph of the overall PSS memory usage of different processes.
$ sudo smem --pie name -c "pss"
As a summary, smem is a simple and effective memory analysis tool that comes in handy in various circumstances. Using its formatted output, you can run smem to identify any memory issues and take an action in an automatic fashion. If you know of any good memory monitoring tool, share it in the comment.

No comments:
Post a Comment