http://xmodulo.com/combine-two-graphs-cacti.html
Cacti is a fantastic open source network monitoring system that is widely used to graph network elements like bandwidth, storage, processor and memory utilization. Using its web based interface, you can create and organize graphs easily. However, some advanced features like merging graphs, creating aggregate graphs using multiple sources, migration of Cacti to another server are not provided by default. You might need some experience with Cacti to pull these off. In this tutorial, we will see how we can merge two Cacti graphs into one.
Consider this example. Client-A has been connected to port 5 of switch-A for the last six months. Port 5 becomes faulty, and so the client is migrated to Port 6. As Cacti uses different graphs for each interface/element, the bandwidth history of the client would be split into port 5 and port 6. So we end up with two graphs for one client - one with six months' worth of old data, and the other that contains ongoing data.
In such cases, we can actually combine the two graphs so the old data is appended to the new graph, and we get to keep a single graph containing historic and new data for one customer. This tutorial will explain exactly how we can achieve that.
Cacti stores the data of each graph in its own RRD (round robin database) file. When a graph is requested, the values stored in a corresponding RRD file are used to generate the graph. RRD files are stored in /var/lib/cacti/rra in Ubuntu/Debian systems and in /var/www/cacti/rra in CentOS/RHEL systems.
The idea behind merging graphs is to alter these RRD files so the values from the old RRD file are appended to the new RRD file.
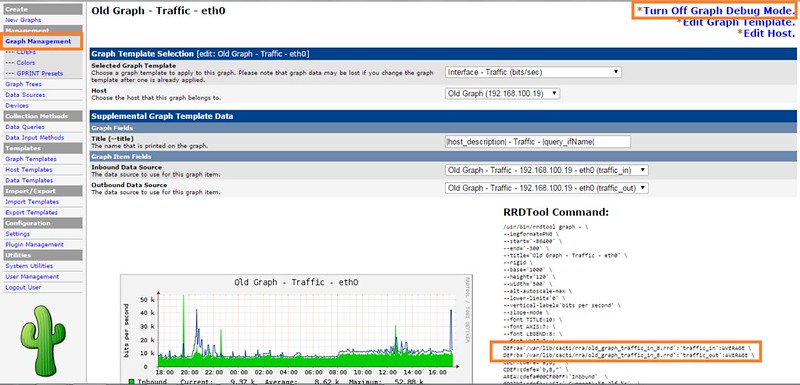
Old graph:
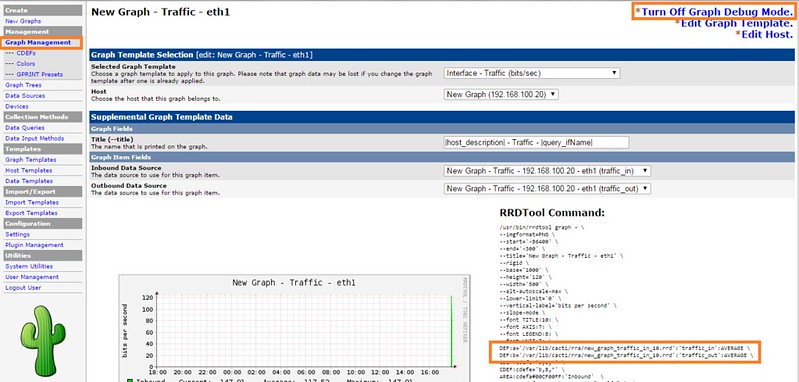
New graph:
From the example output (which is based on a Debian system), we can identify the RRD files for two graphs:
Next, make sure that the file is owned by Apache user.
On Debian or Ubuntu, run the following command:
To sum up, this tutorial showed how we can easily merge two Cacti graphs into one. This trick is useful when a service is migrated to another device/interface and we want to deal with only one graph instead of two. The script is very handy as it can join graphs regardless of the source device e.g., Cisco 1800 router and Cisco 2960 switch.
Hope this helps.
Cacti is a fantastic open source network monitoring system that is widely used to graph network elements like bandwidth, storage, processor and memory utilization. Using its web based interface, you can create and organize graphs easily. However, some advanced features like merging graphs, creating aggregate graphs using multiple sources, migration of Cacti to another server are not provided by default. You might need some experience with Cacti to pull these off. In this tutorial, we will see how we can merge two Cacti graphs into one.
Consider this example. Client-A has been connected to port 5 of switch-A for the last six months. Port 5 becomes faulty, and so the client is migrated to Port 6. As Cacti uses different graphs for each interface/element, the bandwidth history of the client would be split into port 5 and port 6. So we end up with two graphs for one client - one with six months' worth of old data, and the other that contains ongoing data.
In such cases, we can actually combine the two graphs so the old data is appended to the new graph, and we get to keep a single graph containing historic and new data for one customer. This tutorial will explain exactly how we can achieve that.
Cacti stores the data of each graph in its own RRD (round robin database) file. When a graph is requested, the values stored in a corresponding RRD file are used to generate the graph. RRD files are stored in /var/lib/cacti/rra in Ubuntu/Debian systems and in /var/www/cacti/rra in CentOS/RHEL systems.
The idea behind merging graphs is to alter these RRD files so the values from the old RRD file are appended to the new RRD file.
Scenario
The services for a client is running on eth0 for over a year. Because of hardware failure, the client has been migrated to eth1 interface of another server. We want to graph the bandwidth of the new interface, while retaining the historic data for over a year. The client would see only one graph.Identifying the RRD for the Graph
The first step during graph merging is to identify the RRD file associated with a graph. We can check the file by opening the graph in debug mode. To do this, go to Cacti's menu: Console > Graph Management > Select Graph > Turn On Graph Debug Mode.Old graph:
New graph:
From the example output (which is based on a Debian system), we can identify the RRD files for two graphs:
- Old graph: /var/lib/cacti/rra/old_graph_traffic_in_8.rrd
- New graph: /var/lib/cacti/rra/new_graph_traffic_in_10.rrd
Preparing a Script
We will merge two RRD files using a RRD splice script. Download this PHP script, and install it as /var/lib/cacti/rra/rrdsplice.php (for Debian/Ubuntu) or /var/www/cacti/rra/rrdsplice.php (for CentOS/RHEL).Next, make sure that the file is owned by Apache user.
On Debian or Ubuntu, run the following command:
# chown www-data:www-data rrdsplice.php
and update rrdsplice.php accordingly. Look for the following line:chown($finrrd, "apache");and replace it with:
chown($finrrd, "www-data");On CentOS or RHEL, run the following command:
# chown apache:apache rrdsplice.php
Merging Two Graphs
The syntax usage of the script can easily be found by running it without any parameters.
# cd /path/to/rrdsplice.php
# php rrdsplice.php
# php rrdsplice.php
USAGE: rrdsplice.php --oldrrd=file --newrrd=file --finrrd=fileNow we are ready to merge two RRD files. Simply supply the names of an old RRD file and a new RRD file. We will overwrite the merged result back to the new RRD file.
# php rrdsplice.php --oldrrd=old_graph_traffic_in_8.rrd
--newrrd=new_graph_traffic_in_10.rrd
--finrrd=new_graph_traffic_in_10.rrd
Now the data from the old RRD file should be appended to the new RRD.
Any new data will continue to be written by Cacti to the new RRD file.
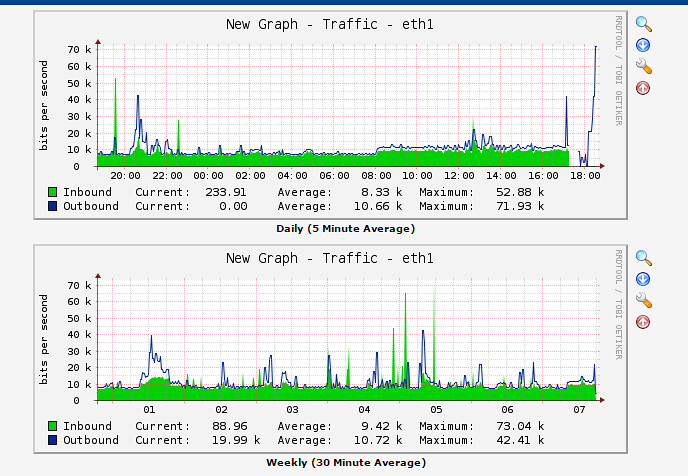
If we click on the graph, we should be able to verify that the weekly,
monthly and yearly records have also been added from the old graph. The
second graph in the following diagram shows weekly records from the old
graph.To sum up, this tutorial showed how we can easily merge two Cacti graphs into one. This trick is useful when a service is migrated to another device/interface and we want to deal with only one graph instead of two. The script is very handy as it can join graphs regardless of the source device e.g., Cisco 1800 router and Cisco 2960 switch.
Hope this helps.

No comments:
Post a Comment