http://xmodulo.com/how-to-count-the-number-of-open-network-connections-on-linux.html
One of system resources to monitor closely as a system administrator is network connections. In order to maintain adequate networking performance on a server, you need to watch out for any abnormal behavior in network connections (e.g., unusually high volume of connection requests), and act on it (e.g., filter DDoS or port scanning attacks).
In this tutorial, I will describe how to monitor active network connections, and how to count the number of open network connections on Linux.
When it comes to monitoring network connections, conntrack-tools is very useful. conntrack-tools are a suite of user-space utilities that allow you to view and manage network connection states that the Linux kernel keeps track of. To use conntrack-tools, Linux kernel 2.6.18 or later is recommended.
If you want to monitor IPv6 connections, you can load nf_conntrack_ipv6 module as well.
Ubuntu, Debian or Linux Mint:
To print all network connections being tracked with conntrack, run the following command.
The output will show different types of IPv4-based connections including TCP, UDP and ICMP traffic. For TCP-based network connections, the output will include not only currently active connections (in "ESTABLISHED" state), but also connections that are opening up (in "SYNC_SENT" or "SYNC_RECV" state) or connections that are about to be closed (in "TIME_WAIT", "CLOSE_WAIT" or "FIN_WAIT" state).
To count the total number of network connections at the moment, simply run:
You can apply various filtering in the output of conntrack tool.
For example, to display open TCP connections only, run the following command.
To show UDP network connections with destination port 500:
Before using conntrackd, make sure that conntrackd configuration in /etc/conntrackd/conntrackd.conf is correct in terms of network interface and IPv4 address (if they are specified), as shown below.
If there is no such specification, you can use the default configuration without any modification.
To run conntrackd as a daemon:

One of system resources to monitor closely as a system administrator is network connections. In order to maintain adequate networking performance on a server, you need to watch out for any abnormal behavior in network connections (e.g., unusually high volume of connection requests), and act on it (e.g., filter DDoS or port scanning attacks).
In this tutorial, I will describe how to monitor active network connections, and how to count the number of open network connections on Linux.
When it comes to monitoring network connections, conntrack-tools is very useful. conntrack-tools are a suite of user-space utilities that allow you to view and manage network connection states that the Linux kernel keeps track of. To use conntrack-tools, Linux kernel 2.6.18 or later is recommended.
Load Necessary Kernel Modules
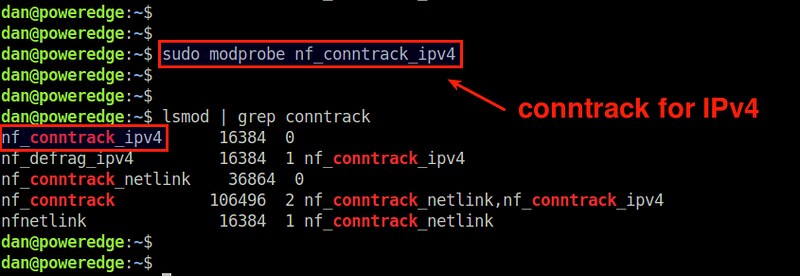
To monitor open IPv4 network connections with conntrack-tools, first make sure that a kernel module called nf_conntrack_ipv4 is loaded on your system.
$ sudo modprobe nf_conntrack_ipv4
If you want to monitor IPv6 connections, you can load nf_conntrack_ipv6 module as well.
$ sudo modprobe nf_conntrack_ipv6
Depending on distributions you are using, these modules may already come preloaded.Install conntrack-tools on Linux
After verifying that nf_conntrack_ipv4 module is loaded, go ahead and install conntrack-tools, as well as all prerequisite packages as follows.Ubuntu, Debian or Linux Mint:
$ sudo apt-get install conntrack conntrackd libnetfilter-conntrack3
CentOS, Fedora or RHEL:
$ sudo yum install conntrack-tools libnetfilter_conntrack
Monitor Open Network Connections with conntrack Utility
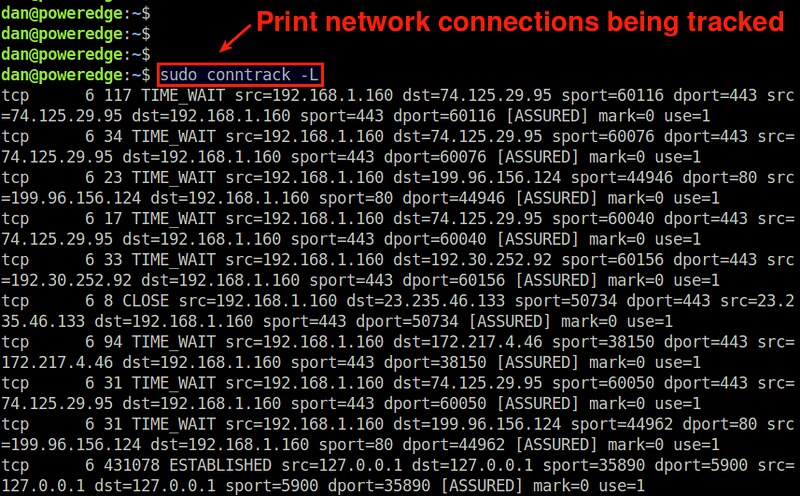
A command-line tool called conntrack comes with conntrack-tools package. The conntrack utility allows you to search, list, inspect network connection states from the command line.To print all network connections being tracked with conntrack, run the following command.
$ sudo conntrack -L
The output will show different types of IPv4-based connections including TCP, UDP and ICMP traffic. For TCP-based network connections, the output will include not only currently active connections (in "ESTABLISHED" state), but also connections that are opening up (in "SYNC_SENT" or "SYNC_RECV" state) or connections that are about to be closed (in "TIME_WAIT", "CLOSE_WAIT" or "FIN_WAIT" state).
$ sudo conntrack -C
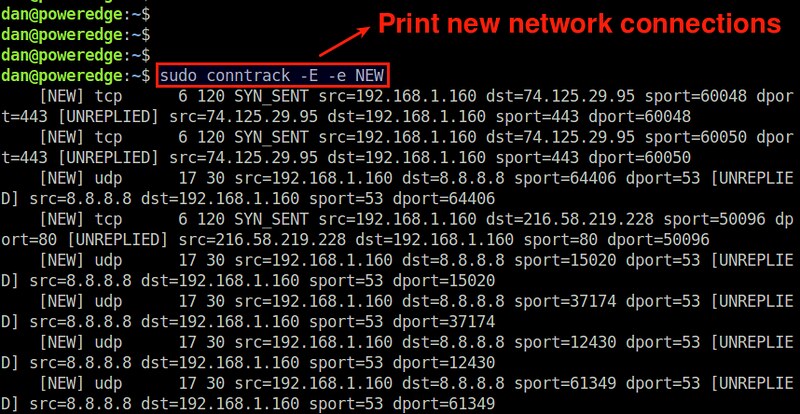
51If you want to monitor newly created network connections as real-time events, use the following command.
$ sudo conntrack -E -e NEW
This command will print only those connections whose status is NEW.
Thus each time a new network connection is established, the event will
appear in the screen in real-time.You can apply various filtering in the output of conntrack tool.
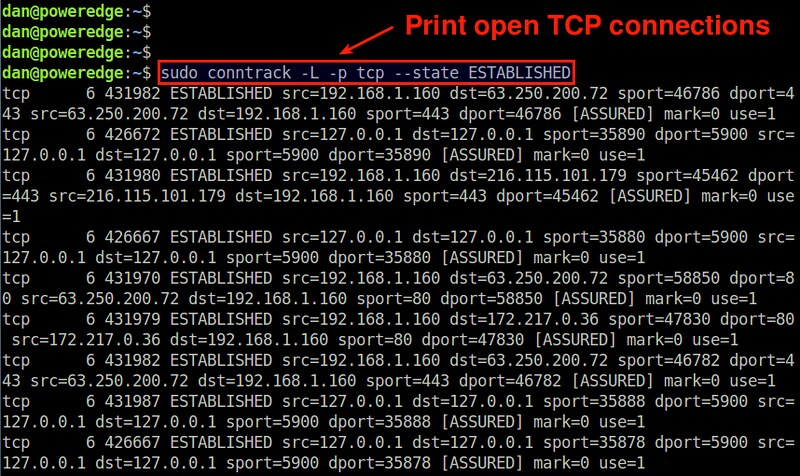
For example, to display open TCP connections only, run the following command.
$ sudo conntrack -L -p tcp --state ESTABLISHED
To show UDP network connections with destination port 500:
$ sudo conntrack -L -p udp --dport 500
If you want to monitor new SSH connections in real-time, run the following.
$ sudo conntrack -E -e NEW -p tcp --dport 22
Monitor Open Network Connections with conntrackd Daemon
Another tool for network connection monitoring is conntrackd, user-space daemon for connection tracking system. While conntrackd is originally designed to synchronize the kernel's connection tracking state between multiple (e.g., active/standby) firewall instances in high availability deployment, it can be used to collect and view statistics on network connection events (e.g., NEW, UPDATE, DESTROY) for monitoring purposes.Before using conntrackd, make sure that conntrackd configuration in /etc/conntrackd/conntrackd.conf is correct in terms of network interface and IPv4 address (if they are specified), as shown below.
$ sudo vi /etc/conntrackd/conntrackd.conf
1
2
3
4
5
6
7
| Sync Multicast { . . . . . IPv4_interface 192.168.1.253 Interface eth0 . . . . . } |
To run conntrackd as a daemon:
$ sudo conntrackd -d
Once conntrackd daemon is running in the background, you can dump the statistics collected by the daemon as follows.
$ sudo conntrackd -s
cache internal:
current active connections:            2
connections created:             4 failed:            0
connections updated:            13 failed:            0
connections destroyed:             2 failed:            0

cache external:
current active connections:            0
connections created:             0 failed:            0
connections updated:             0 failed:            0
connections destroyed:             0 failed:            0

traffic processed:
                   0 Bytes                         0 Pckts

multicast traffic (active device=eth0):
                9624 Bytes sent                    0 Bytes recv
                1138 Pckts sent                    0 Pckts recv
                   0 Error send                    0 Error recv

message tracking:
                   0 Malformed msgs                    0 Lost msgs
Download this article as ad-free PDF (made possible by your kind donation):

No comments:
Post a Comment